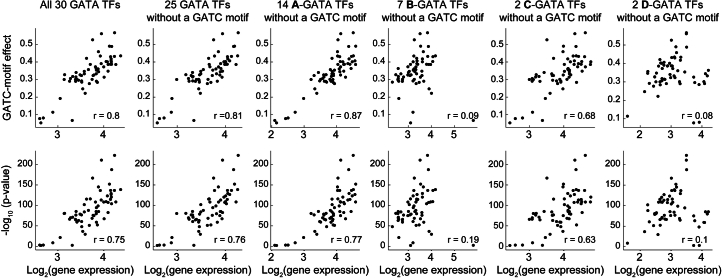
Extended Data Fig. 10. Correlation between GATC-motif effect and expression of GATA transcription factors.
Shown is the relationship between the GATC-motif effect (upper row) and the associated fit p-value (lower row), as determined in Fig. 5d, across various tissues part of ref. 31 dataset vs. the mean expression levels of GATA TFs within the same tissues. The average expression is calculated across different groups of GATA TFs: all 30 GATA TFs (1st column), the subset of 25 GATA TFs lacking the GATC motif within 500 bp downstream of the TSS (2nd column), and GATA TFs excluding those with the GATC motif and categorized into subfamilies A (3rd column), B (4th column), C (5th column), and D (6th column), according to classifications by refs. 25,35. The number of GATA TFs included in the average for each plot is noted in the column titles. The analysis of GATA TFs lacking the motif serves as a control to ensure that the correlation is not influenced by GATA TFs regulated by the GATC motif themselves. Pearson’s correlation coefficients are displayed on each scatter plot (r). Notably, DAP-Seq analysis by ref. 19 has demonstrated that the A subfamily of GATA TFs binds to the GATC motif downstream of the TSS (Supplementary Fig. 16).

