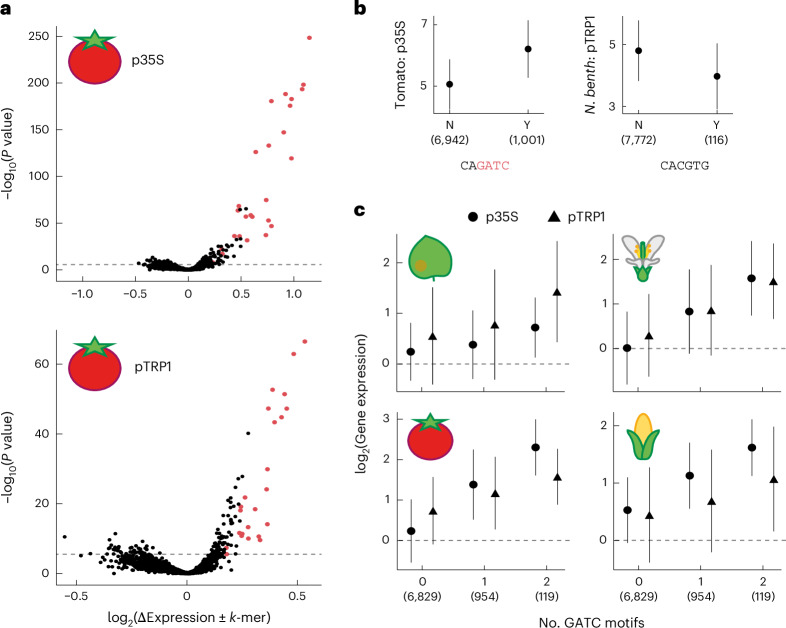
Fig. 3. The GATC motif is associated with high expression when positioned downstream of the TSS.
a, Association of 6-mers with downstream MPRA activity. Each 6-mer’s presence (or absence) in downstream-derived fragments was compared based on the difference in average log2(gene expression) (x axis) and a two-sided Mann–Whitney U-test P value (y axis). Displayed for p35-based (top) and pTRP1-based (bottom) constructs in tomato. Red points denote 6-mers with GATC; dashed line marks the 5% Bonferroni multiple-testing threshold. b, Activity distribution for downstream-derived fragments with (Y) or without (N) 6-mers when inserted downstream. Plotted as log2(gene expression) in the MPRA for CAGATC in tomato with p35S-based constructs (left) and for CACGTG (G-box54) in N. benthamiana with pTRP1-based constructs (right). c, Relative activity of downstream fragments when inserted downstream as a function of the number of YVGATCBR consensus motifs in the tested fragments. Group sizes: 6,829 (no motif), 954 (one motif) and 119 (two motifs). Error bars in b and c represent mean ± 1 s.d. Backbone and species are indicated. The numbers in parentheses in b and c indicate the number of fragments.

