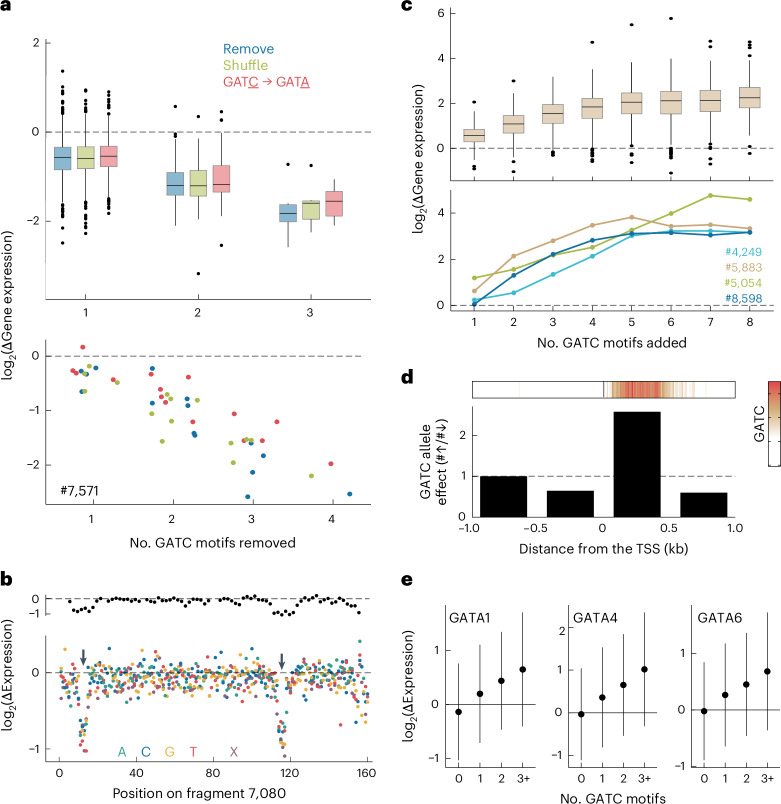
Fig. 4. The GATC motif is sufficient to increase expression when positioned downstream of the TSS.
a–c, Differences in activity of the p35S-downstream library between original and mutated fragments. a, Effect of removing GATC motifs on the activity of 823 fragments initially containing the motif (top) and a specific example (fragment 7,571) with four motifs (bottom). Motifs were removed by deletion, 8-bp shuffle or GATC-to-GATA mutation. b, Deep mutagenesis of fragment 7,080: effects of 10-bp deletions (top), 1-bp deletions (X) or 1-bp mutations (bottom). Arrows highlight GATC motifs. c, Effects of adding GATC motifs for 221 fragments with incremental motif additions (top) and four specific examples (bottom). d, GATC motif-gain or motif-loss alleles in the 1001 Genomes population of accessions linked to nearby gene expression. The bar graph showcases the ratio of the number of significant associations with higher versus lower expression in the GATC motif allele, grouped by distance to the TSS (bottom). Top, GATC motif’s enrichment in proximity to the TSS for all Arabidopsis genes. e, Gene expression response to overexpression of GATA TFs (individual graphs) versus GFP, plotted for genes with 0, 1, 2 or ≥3 GATC motifs within 500 bp downstream of the TSS. The groups contain 11,435, 4,039, 944 and 343 genes, respectively. Overexpression of GATA TFs or GFP was driven by double 35S promoters in Arabidopsis protoplasts, which were collected 8 h after transformation. Error bars represent mean ± 1 s.d. Box plots in a and c display the median (center line), the interquartile range (IQR; box bounds), whiskers (minimum and maximum within 1.5 IQR) and outliers (points beyond whiskers).

