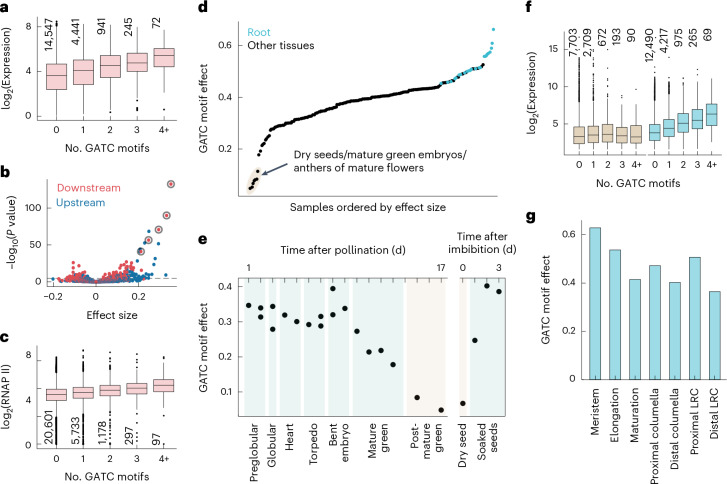
Fig. 5. Cell type specificity of the GATC motif effect on gene expression.
a, In aerial parts of Arabidopsis seedlings55, gene expression correlates with the number of GATC motifs within 500 bp downstream of the TSS. Expression values are depicted for various motif counts, with ‘4+’ representing four to nine motifs. A linear fit reveals a GATC motif effect size of 0.4 (P value = 5 × 10−128), indicating the average expression increase for each added motif. b, For all 6-mers within 500 bp upstream (blue points) or downstream (red points) of the TSS, effect size and P value are determined as in a. The five most significant downstream 6-mers, all containing the GATC sequence, are highlighted with circles. A 5% Bonferroni threshold is indicated by a dashed line. c, Average RNA polymerase (RNAP) II occupancy at genes plotted as in a, with an effect size of 0.17 (P value = 10−107). d, GATC motif effect sizes from a compendium of 200 tissue-specific gene expression datasets30–32, as determined in a. Samples with the lowest effect sizes are shaded and detailed. e, Chart of GATC effect size during embryo and seed development and upon imbibition31,32,56. f, Expression values in dry seeds (brown) and seedling roots31 (blue), plotted as in a, with effect sizes of 0.07 (P value = 2.6 × 10⁻³) and 0.57 (P value = 4 × 10−400), respectively. g, GATC effect sizes across different root developmental stages, averaged from single-cell expression data33. LRC, lateral root cap. Box plots in a, c and f display the median (center line), the IQR (box bounds), whiskers (minimum and maximum within 1.5 IQR) and outliers (points beyond whiskers); the number of genes per category is also indicated. P values in a–c and f were calculated using a two-sided t-statistic.

