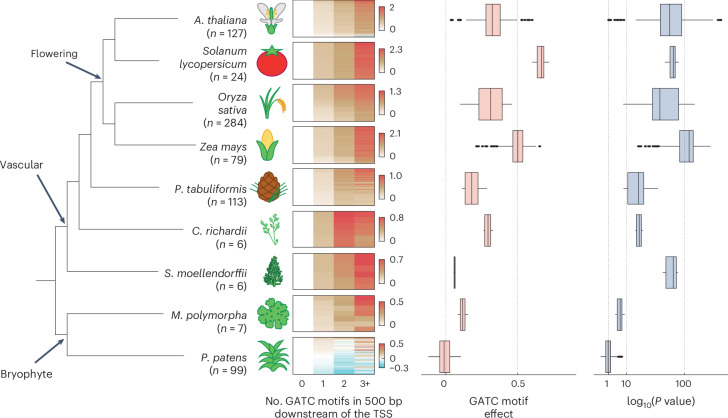
Fig. 6. Downstream GATC motif correlates with gene expression in vascular plants.
Heatmap of average log2(expression change) of multiple transcriptome datasets for genes, categorized by 0, 1, 2 or ≥3 GATC motifs within 500 bp downstream of the TSS, across land plant species. Number of datasets (n) is indicated. Expression is normalized to the 0-motif group, with species-specific color scales. The effect on expression (slope) and the significance of association (two-sided t-statistic P value) of the GATC motif, as in Fig. 5, are presented. Box plots show the median (center line), the IQR (box bounds), whiskers (minimum and maximum within 1.5 IQR) and outliers (points beyond whiskers). The right x axis is square-root scaled.

