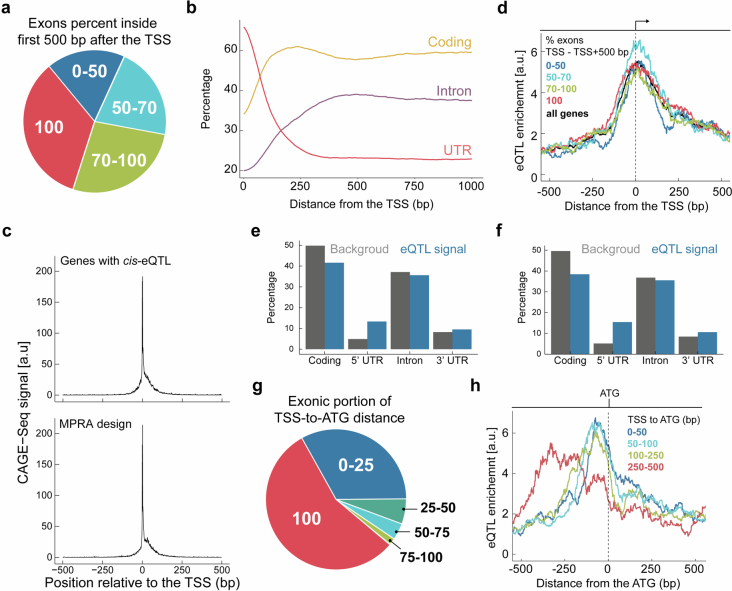
Extended Data Fig. 1. No association between exon-intron structure and eQTL enrichment near TSS.
(a) Genes grouped according to fraction of exonic sequence in the 500 bp following the TSS for A. thaliana genes. Four groups represent gene portions with different exon content: up to 50%, 50%–70%, 70%–100%, and 100%. This grouping is the same as the grouping in d. (b) Percentage of genomic sequence coverage by different genomic features as a function of distance from the TSS (c) Experimental support for the accuracy of TSS annotations for genes with eQTLs shown in Fig. 1a (top panel) and genes used to design the oligo pool for the massively parallel reporter assay (MPRA, bottom panel). The figure shows cap analysis gene expression followed by sequencing (CAGE-Seq) data from ref. 65 plotted around the TSS of genes. CAGE-Seq reads for each gene are normalized to a total score of 1, and reads from three experimental replicates are summed for each position relative to the TSS across all genes in that group. The peak signal at the TSS confirms the accuracy of the TSS annotations used in the analysis. (d) eQTL enrichment near TSS for genes with varying exonic fraction within the first 500 bp after TSS, shown as in Fig. 1a. Gene counts per group: 914 (0%–50%), 1,044 (50%–70%), 1,179 (70%–100%), 1,102 (100%). (e-f) The proportion of eQTL signals within transcripts, as determined by the posterior inclusion probability across various genomic features, compared to the total length of these features in genes where significant associations have been found. Plotted for first (e) or second (f) batch from ref. 14. (g) Genes grouped according to fraction of exonic (5′ UTR) sequence in the TSS-to-ATG regions for A. thaliana genes. Five groups represent gene portions with different exonic fractions: 0%–25%, 25%–50%, 50%–75%, 75%–100%, and 100%. These analyses highlight the genomic composition of the TSS-to-ATG region, which is the focus of the analysis, for example in h and Fig. 1b. (h) eQTL enrichment for genes with different TSS-to-ATG distances, as in Fig. 1b, with data aligned to the ATG and not the TSS. In a, d, and g, groups exclude the upper limit, that is, A%-B% represents A%≤x < B%.

