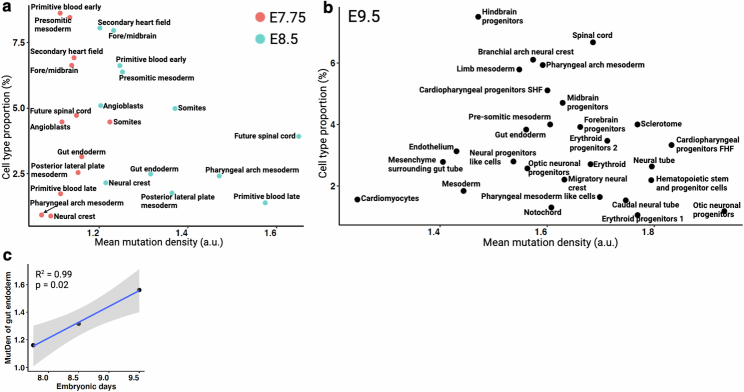
Extended Data Fig. 6. Catalog of cellular turnover across embryonic timepoints.
(a) Comparative mutation density that corresponds to cellular turnover between two time points (E7.75 and E8.5). Here we show only a selective list of tissue types. See supplemental table 2 for mutation density of all the tissue types. The difference between Primitive blood early vs late at E8.5, implies that this cell type is highly proliferating and/or this cell type is derived from alternative high proliferating progenitors. (b) Cellular turnover across cell types at E9.5 embryo. Hematopoietic cell types show relatively high cellular turnover compared to other somatic cell types. (c) Consistent increase of gut endoderm cellular turnover across 3-ETP. Pearson’s coefficient of determinant (R2) and p value (by F-test) are indicated. Shaded area indicates 95% confidence intervals of the regression line.

