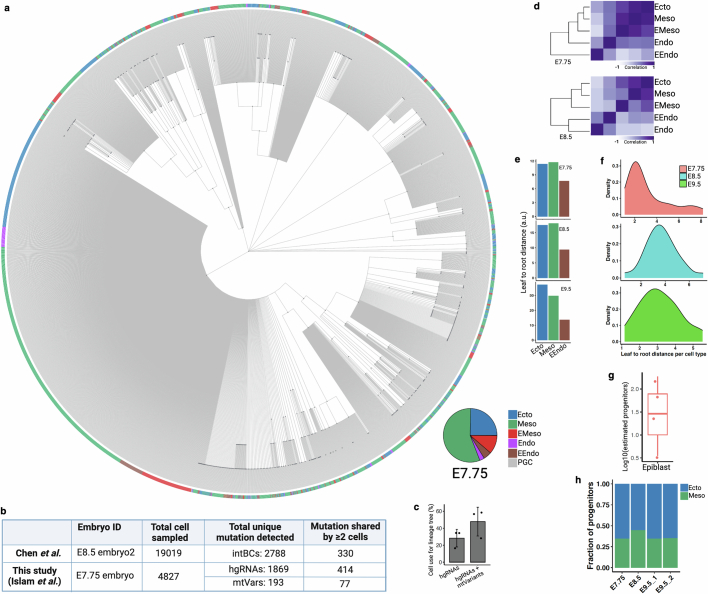
Extended Data Fig. 7. Lineage reconstruction of mouse embryogenesis.
(a) Reconstructed single-cell lineage tree from E7.75 embryo. Leaf cells are colored by germ layer colors and the proportions of cells in the tree are shown as a pie chart (inset). Nodes are colored by dark gray. Each branch represents an independent mutation event. Non-binary single-cell trees for all embryos and adult tissues can be found in NSC-seq GitHub page. (b) Table summarizing the lineage informative mutations (shared between ≥ 2 cells) detected between two studies (Chen et al.14 and this study) that performed similar whole mouse embryonic lineage tracking using constitutive Cas9. Here, we compared only the best reported embryo data between two studies. (c) After combining mtVars with hgRNA mutations, number of cells with lineage informative mutations increases for single-cell lineage tree reconstruction. Note that there are high variabilities in the proportion of cell that can be used for lineage tree reconstruction among samples due to multiple reasons, including the barcode detection limit, sequencing depth, number of cells captured per experiment, and time required to accumulate mutations. Bar plots, mean (n = 3 independent NSC-seq libraries); error bar, mean ± s.d. (d) Pearson correlation coefficient heat maps of variant proportions combining hgRNAs and mtVars for germ layers presented as pseudobulk. (e) Phylogenetic distance proportion was calculated (Supplemental method) from reconstructed lineage trees using reported approach70. Extraembryonic endoderm (EEndo) shows less distance from root compared to ectoderm or mesoderm across embryos, supporting nearby proximity to root (zygote). (f) Distribution of normalized phylogenetic distance (leaf to root) for annotated cell types. Wide distribution of the distance across cell types are found at E8.5 and E9.5 compared to E7.75, supporting minimal lineage divergence at E7.75 stage, similar to minimal tissue-specific proliferation reported before (Fig. 2d). (g) Estimated epiblast progenitor number calculated across embryos (n = 4) using reported approach71. Average number of epiblast progenitor field size is around 28, similar to previous report14. High variability may reflect embryo specific constrain in pluripotent cells number that contributes to somatic lineages72. Box plot shows the median, box edges represent the first and third quartiles, and the whiskers extend to a minimum and a maximum of 1.5 × IQR beyond the box. (h) Proportion of estimated progenitor population between ectoderm and mesoderm. It has been reported that the number of ectoderm progenitors is more than the number of mesoderm progenitors at the epiblast of the prestreak stage mouse embryo73. Panel b created using BioRender (https://BioRender.com).

