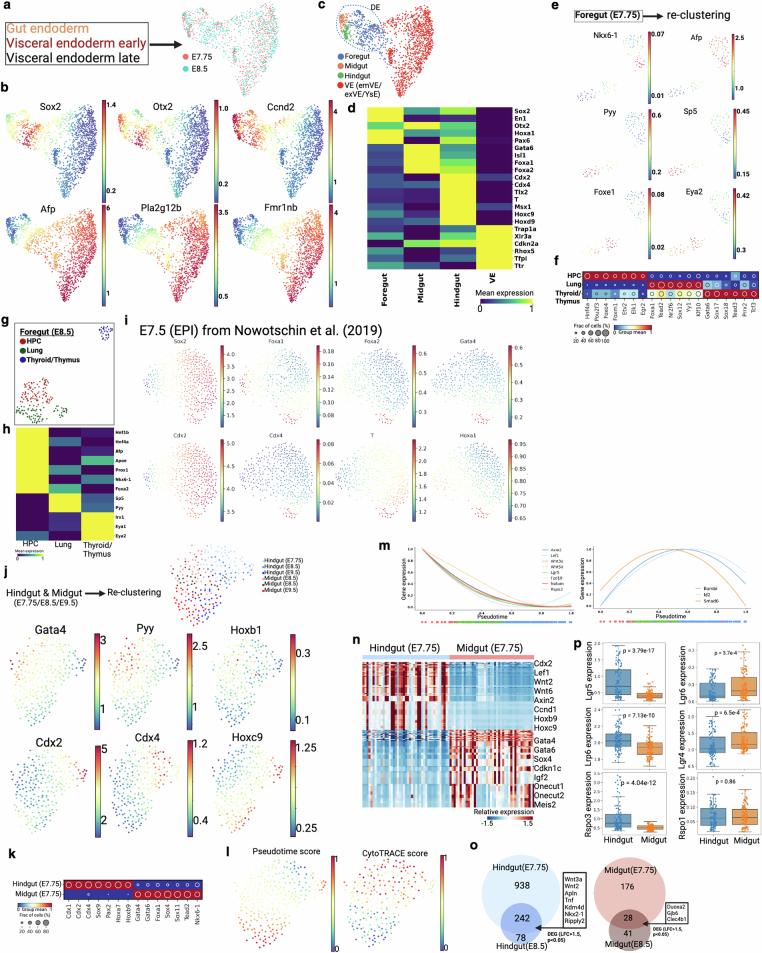
Extended Data Fig. 9. Gut endoderm development and progenitor specification.
(a) Force-directed layout of three endoderm clusters from Extended Data Fig. 4a. Cells are colored by two embryonic time points. (b) Gene expression of definitive endoderm (Sox2, Otx2, and Ccnd2) and visceral endoderm (Afp, Pla2g12b, and Fmr1nb) specific markers. (c-d) Based on region specific marker gene expression, DE (dotted line) is divided into three clusters, supporting regionalization of gut endoderm. Here, VE is the combination of embryonic visceral endoderm (emVE), extra-embryonic visceral endoderm (exVE), and yolk sac endoderm (YsE). Heat map of selective gut specific marker genes (y axis) as mean expression for each tissue type (x axis) are shown here in d. (e) Force-directed layout of foregut cells from E7.75 embryo. Three clusters are associated with three progenitor population. HPC, hepatopancreatic cells. Gene expression of HPC (Nkx6-1, Afp), lung (Pyy, Sp5), and thyroid/thymus (Foxe1, and Eye2) clusters are shown here. See Fig. 3c for more genes. (f) Regulon activity is shown across the three tissue types. (g-h) Force-directed layout of foregut cells from E8.5 embryo. Heat map of selective marker genes (y axis) as mean expression for each tissue type (x axis). (i) Force-directed layout of epiblast cells at E7.5. This scRNA-seq data and epiblast annotations are taken from a previous study29. Cells are colored by gut progenitor specific markers. (j) Force-directed layout of hindgut and midgut cells from three embryonic time points. Cells are colored by three time points and two corresponding tissue types. Midgut (Gata4, Pyy, and Hoxb1) and hindgut (Cdx2, Cdx4, and Hoxc9) specific markers are shown in the bottom. (k) Regulon activity of hindgut and midgut cells at E7.75. (l) Palantir pseudo-time76 and CytoTRACE score77 distribution in midgut and hindgut across three time points. (m) Normalized Wnt and Bmp signaling gene expression dynamics. X-axis trajectory over pseudo-time shown in l. Dot points below the plots are the pseudo-time coordinates of cells from each time point colored according to time point as in Fig. 3f. (n) Heat map shows differential gene expression between hindgut and midgut at E7.75. Cell type-specific selective list of genes are marked on the right. (o) Venn diagram of genes that were upregulated in both E7.75 and E8.5 time point of hindgut and midgut area. (p) Box plots representing normalized expression of Wnt signaling genes between hindgut and midgut for all three time points. Intestinal stem cell marker Lgr5 is overexpressed in hindgut, whereas Lgr4 and Lgr6 are overexpressed in midgut. Box plots show the median, box edges represent the first and third quartiles, and the whiskers extend to a minimum and a maximum of 1.5 × IQR beyond the box. P values are derived from unpaired two-tailed t-test.

