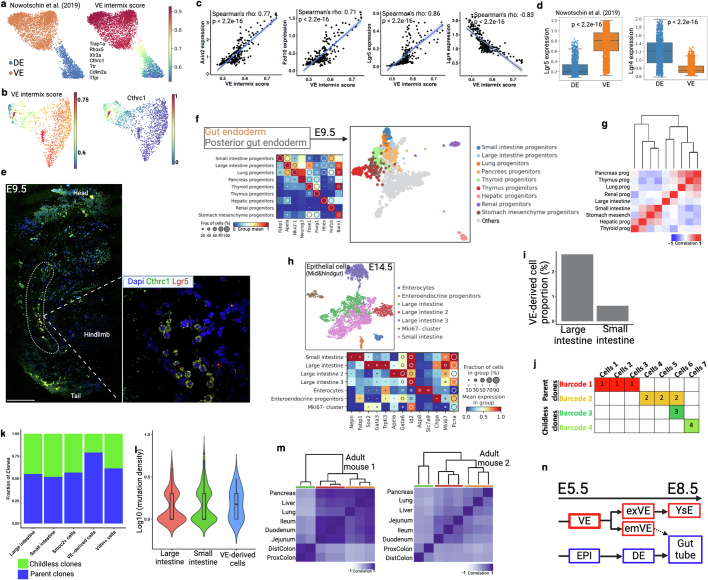
Extended Data Fig. 10. Lineage convergence during gut endoderm development.
(a) Force-directed layout of FACS enriched scRNA-seq data with cell type annotation at E8.75 embryos from a previous study29. Cells are marked by VE intermix signature that was developed from seven reported VE-specific marker genes (right). (b) Endoderm cells from E7.75 and E8.5 are marked by VE intermix score (see Extended Data Fig. 9c for annotation). High intermix score in hindgut area supports predominant VE intermix in hindgut25,30. VE marker gene Cthrc1, reported in a previous study25, preferentially marks VE intermix cells in hindgut (right). (c) Scatter plots representing Wnt signaling gene expression (y-axis) and VE-intermix score (x-axis). Blue line represents fitted linear regression line. Spearman correlation coefficient (ρ) and p value (by F-test) are indicated. Shaded area indicates 95% confidence intervals of the regression line. (d) Discordance in Lgr4 and Lgr5 expression pattern in DE- and VE-derived cells. Here we use data from a previous study29. Box plots show the median, box edges represent the first and third quartiles, and the whiskers extend to a minimum and a maximum of 1.5 × IQR beyond the box. P values are derived from unpaired two-tailed t-test. (e) Multiplex HCR-FISH co-staining of VE marker gene (Cthrc1) and Wnt target genes (Lgr5) at E9.5 embryo section. Inset is a posterior gut region adjacent to hindlimb. Results validated in more than three independent experiments. Scale bar, 300 μm. (f) Force-directed layout and re-clustering of two gut endoderm clusters from E9.5 embryos. (g) Lineage analysis of gut-derived progenitors. The large intestine (hindgut) and the small intestine (midgut) are in different branch of the dendrogram. (h) NSC-seq experiment on an E14.5 embryo. UMAP plot of epithelial cells broadly identifies as large intestinal and small intestinal using gene expression. (i) Relative proportion of VE-derived cells in large intestine and small intestine clusters are shown here. (j) Schematic of barcode-based clonal contribution analysis. If a barcode is present in more than one cell, it’s called as a parent clone (e.g., Barcode 1 and 2). Whereas, if a barcode is present in only one cell, it’s called as a childless clone (e.g., Barcode 3 and 4). Concept drawn from Bowling et al.15. The ratio of parent and childless clones is the indicator of relative contribution among the cell types. (k) VE-derived cells show high parent clone ratio, supporting high contribution to epithelial development. Villin+ cells and Smoc2+ cells are used as control. (l) VE-derived cells show relatively high mutation density corresponding to high cellular turnover. Box plots inside the violin show the median value (thick line), box edges represent the first and third quartiles. (m) Developmental lineage analysis of adult mouse gut-derived tissues from two biological replicates using bulk DNA barcodes. Hindgut (green), midgut (red), and foregut (yellow)-derived tissues in dendrogram colors. Hindgut is displayed as a distinct cluster compared to foregut and midgut. (n) Schematic of lineage relationship between definitive endoderm (DE) and visceral endoderm (VE). Dotted arrow represents intermix of VE and DE that eventually form gut tube. Schematic in n is adapted from ref. 29, Springer Nature Limited, and created using BioRender (https://BioRender.com).

