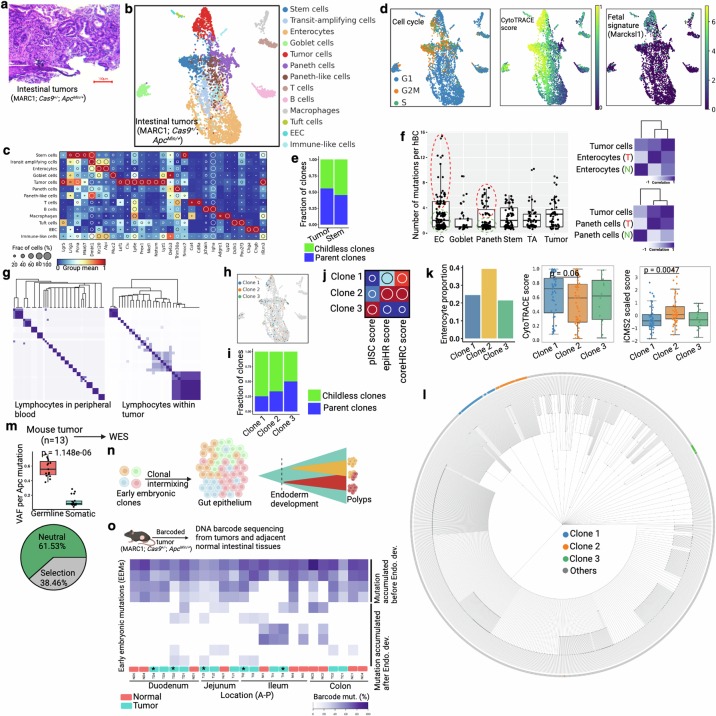
Extended Data Fig. 12. Tracking clonal composition of murine intestinal adenomas.
(a) Hematoxylin and eosin (H&E) staining of ApcMin/+ -driven mouse intestinal tumor. This mouse model generates low grade tumors that are equivalent to human adenoma or precancer. (b-c) UMAP embedding of barcoded intestinal tumor cells from NSC-seq experiment. Tumor cell cluster is assigned based on expression of tumor-associated marker genes as shown in the dot plot in panel c. (d) Cell cycle status, CytoTRACE score, and fetal gene (Marcksl1) expression79 across annotated cell types. (e) Clonal contribution analysis for CBCs and Tumor cells. (f) Box plots represent number of mutations per homing barcodes (hBC) across major annotated cell types. Based on mutation density, EC and Paneth cells are divided into two groups: red (T) and green (N) doted circles. Box plots show the median, box edges represent the first and third quartiles, and the whiskers extend to a minimum and a maximum of 1.5 × IQR beyond the box. Lineage analysis of EC and Paneth cells subsets with Tumor cells supports tumor cell-derived Paneth and enterocyte population49. (g) Heat map represents pairwise barcode mutations correlation for lymphocytes. Peripheral blood lymphocytes are from Extended Data Fig. 3g and tumor infiltrating lymphocytes are from panel b. (h) Three clones are projected onto the UMAP. See Fig. 4a for clone assignment. (i) Differential parent clone fraction is shown for the three representative clones. (j) Dot plots represent differential distribution of pISC score, epiHR score, and coreHRC score across three clones80. (k) Differential distribution of enterocyte proportion, CytoTRACE score, and iCMS2 score across clones. Box plots (middle and right panels) show the median, box edges represent the first and third quartiles, and the whiskers extend to a minimum and a maximum of 1.5 × IQR beyond the box. P value from unpaired two-tailed t-test. (l) Single-cell lineage tree is reconstructed using cells from panel b. Clones are labeled by same color as in h. See Supplemental methods for lineage tree reconstruction. (m) WES of mouse tumors. Average germline VAF (~0.5) across the tumors supports diploid genome of these tumors. Box plots show the median, box edges represent the first and third quartiles, and the whiskers extend to a minimum and a maximum of 1.5 × IQR beyond the box. P value from unpaired two-tailed t-test. WES based tumor evolution model also supports selective evolutionary pressure in mouse tumors (bottom). See Fig. 4c for Apc mutation. (n) Schematic of early embryonic clonal intermix-based clonal initiation assessment. Some tumors could show mosaic early embryonic mutations, supporting possible polyclonal initiation (more than one early embryonic clones). (o) Heat map shows mosaic distribution of early embryonic mutations across regionally distinct tumors and adjacent normal tissues from the same mouse using DNA barcode sequencing. Color represents the proportion of mutant barcode. First four mutations are widely present across tissues, representing their initiation before endoderm development. Four of the five polyclonally initiated tumors (asterisk and assigned by the number of Apc mutation) show intermix of multiple early embryonic clonal that are also found in adjacent normal epithelium. This data suggests early intermixing of clones during mouse gut epithelial development and consistent with polyclonal origins of tumors attributed in human colorectal polyps53. See Supplement table 4 for location of tumors and adjacent normal tissues across intestinal epithelium. Panel n and o created using BioRender (https://BioRender.com).

