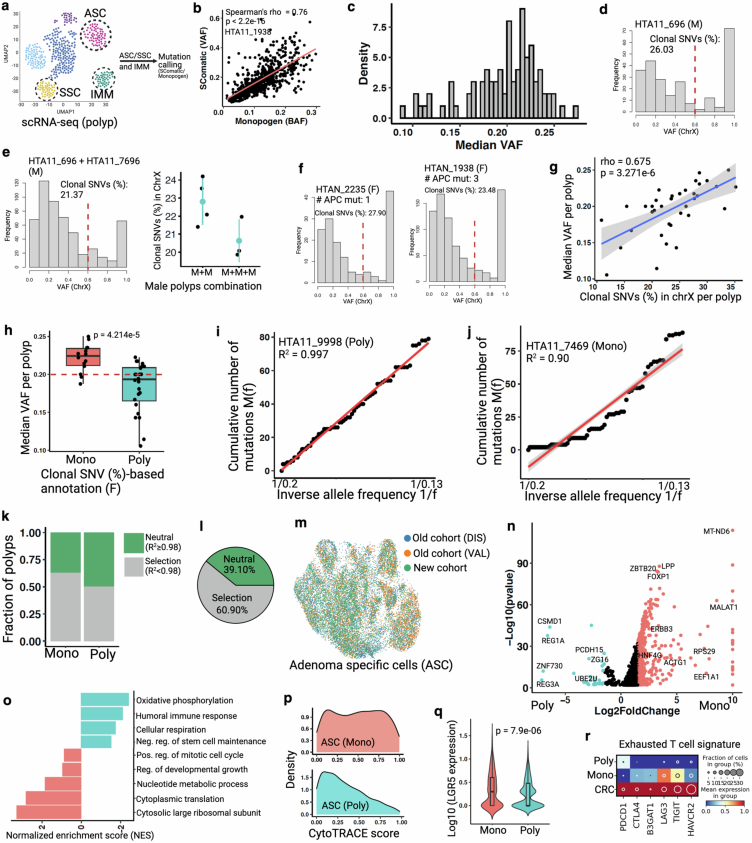
Extended Data Fig. 14. Multi-omic analysis of human colorectal polyps.
(a) Schematic representation of mutation calling from polyp-derived single cells. Here, we use transcriptionally assigned abnormal cells (ASC/SSC) to call somatic mutations (SNVs) as pseudo-bulk, with polyp infiltrating immune cells’ (IMM) SNVs as reference to remove germline variants from polyps. (b) Two independent approaches show similar somatic mutation detection from scRNA-seq dataset82,83. Spearman correlation coefficient (ρ) and p value (by F-test) are indicated. See Supplemental method for more details. (c) Density plot represents wide distribution of median VAF in polyps using SComatic82. (d) VAF distribution of X-linked SNVs in a male (M) polyp. Red line indicates cut-off (0.6) for clonal and subclonal SNVs. (e) Simulation experiment, intermixing cells from two or three independent male polyps, shows reduced clonal SNVs (%) depending on the number of polyps intermixed. Note that different polyps have different number of ASC/SSC cell types. Data (dot plots in the right) are mean ± s.d. (f) Frequency plots showing proportion of clonal SNVs (%) in two female (F) polyps with known number of APC mutations. (g) Scatter plot shows significant correlation between median VAF and X-liked clonal SNVs (%)84 in female polyps. Spearman correlation coefficient (ρ) and p value (by F-test) are indicated. Shaded area indicates 95% confidence intervals of the regression line. (h) Box plots show median VAF per monoclonally and polyclonally initiated female polyps (assigned in Fig. 4j). Red line shows medina VAF cut-off (<0.2) to assign clonality to all polyps, including male. Box plots show the median, box edges represent the first and third quartiles, and the whiskers extend to a minimum and a maximum of 1.5 × IQR beyond the box. P value from unpaired two-tailed t-test. (i-j) Linear regression model for allele frequency distribution of sub-clonal mutations46 that can differentiate between neutral (R2 ≥0.98) and selective (R2 < 0.98) evolutionary processes in tumor. Here we use SNVs from WES data. These two polyps are assigned as monoclonal and polyclonally initiated using the number of APC mutations in WES data. Pearson’s coefficient of determinant (R2) is indicated. (k) Monoclonal polyps show higher proportion of selective evolution compared to polyclonally initiated polyps. (l) Overall, ~60% of the polyps show selective clonal evolution. (m) ASC cells from three cohorts. See Chen et al. for cell type assignment48. (n) Volcano plot shows differential gene expression between monoclonal and polyclonally initiated ASC cells. A selective list of genes is labeled here. X-axis is truncated for monoclonal ASC. Only top and bottom median VAF polyps (10–12 polyps per group) derived cells are compared here (See Supplemental table 4). P values derived from Wilcoxon rank-sum test, not corrected for multiple testing. (o) Pathway analysis using DEG shows distinct molecular programs between monoclonal and polyclonally initiated polyps85. (p) High CytoTRACE score in monoclonal ASC cells compared to polyclonal ASC cells supports higher stem cell expansion phenotype in monoclonal polyps contributing to proliferative advantage and subsequent clonal selection. (q) Expression of canonical stem cell marker LGR5 (log10) between two groups. Box plots inside the violin show the median value (thick line), box edges represent the first and third quartiles. P value from unpaired two-tailed t-test. (r) Dot plot representing exhausted T cell signature in monoclonal, polyclonal polyps, as well as CRCs infiltrating immune cells48. Schematic in a created using BioRender (https://BioRender.com).

