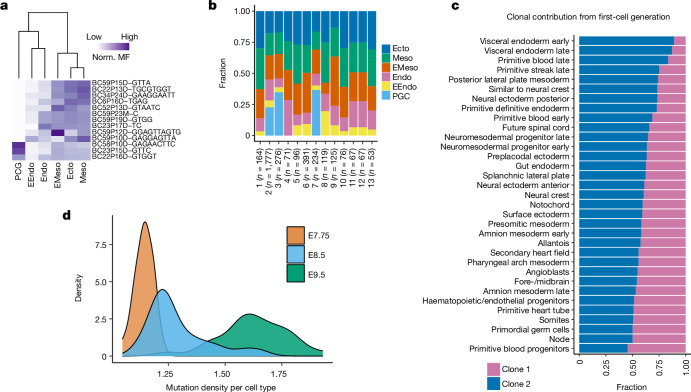
Fig. 2. Lineage and temporal recording of mouse embryogenesis.
a, Normalized (norm.) mosaic fraction (MF) of EEM heat map for E7.75 embryo, used to reconstruct lineage relationships within the major germ layers (Extended Data Figs. 5 and 7). b, Contribution of different EEMs towards various germ layers at E7.75. c, Clonal contribution from a first-cell-generation mutation (clone 1) at E7.75 across individual tissue types (P = 1.57 × 10⁻¹³, Kolmogorov–Smirnov test for the null hypothesis of symmetry) compared with all other clones aggregated as clone 2 (Extended Data Fig. 5l–n). d, Density plots representing cumulative turnover of different tissue types across three embryonic time points. The widths of mutation density distributions represent the variation by which different cell types have proliferated across time points (Extended Data Fig. 6 and Supplementary Table 2 show mutation density per cell type). EMeso, extra-embryonic mesoderm.

