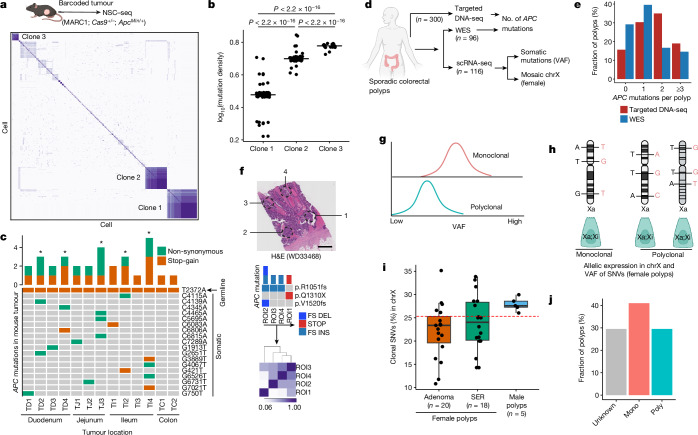
Fig. 4. Clonal origin of colorectal precancer.
a, Pearson correlation coefficient heat maps of variants from mouse intestinal tumour (ApcMin/+)-derived single cells. Distinctly correlated regions are marked by three clones within the same tumour (Extended Data Fig. 12). b, Estimated mutation density for the three assigned clones in a. Black lines represent the median for each clone, unpaired two-tailed t-test. c, OncoPrint plot representing the number of Apc mutations across mouse tumours using WES. d, Overview of experimental design for profiling of clonal origin across multiple human datasets. e, Bar plots summarizing the number of APC mutations per polyp using targeted DNA sequencing and WES (Extended Data Fig. 13). f, Top, multiregion (punch biopsy) WES of a human CRC sample representing distinct APC mutations; bottom, Pearson correlation coefficient heat map of somatic mutations within regions of interest (ROI)13. Scale bar, 2 mm. g, Expected median VAF distribution under different clonal architectures. h, Mosaic X chromosome (chrX) inactivation patterns in female polyps can delineate the clonal origin of cells using expression-based, X-linked somatic clonal SNVs. Male polyps are considered monoclonal due to the single male X chromosome (Extended Data Fig. 14d–f and Supplementary Methods. i, Box plots representing distribution of X-linked clonal SNVs (%) between male and female polyps. Box plots show the median, box edges represent the first and third quartiles and whiskers extend to a minimum and maximum of 1.5× interquartile range beyond the box. Red dashed line is a cut-off to assign clonality in female polyps (Extended Data Fig. 14g,h). j, Summary of median VAF-based polyp profiling. a,d,g,h, Schematics created using BioRender (https://BioRender.com). H&E, haematoxylin and eosin; asterisk, polyclonal tumour; FS DEL, frameshift deletion; FS INS, frameshift insertion; STOP, stop codon.

