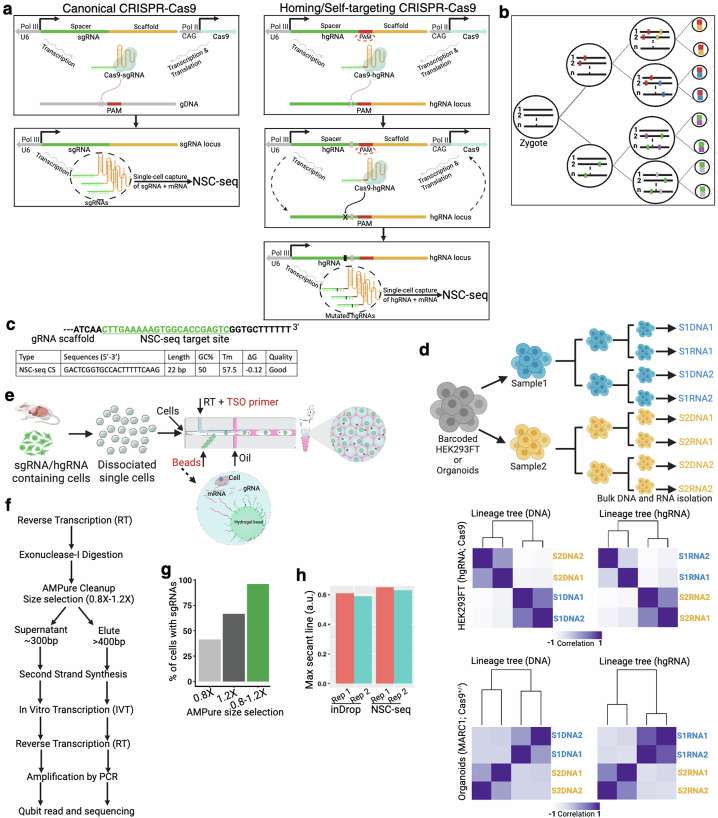
Extended Data Fig. 1. Design and validation of NSC-seq platform.
(a) Schematic representation of canonical CRISPR-Cas9 (left) and homing/self-targeting CRISPR-Cas9 (right). In homing CRISPR, Cas9-hgRNA complex targets the DNA locus encoding the hgRNA itself. (b) Schematic representation of lineage tracking during development using Cas9-induced mutations. (c) Target site for NSC-seq capture sequence (green), along with quality metrics of the capture sequence primer. (d) Experimental design of control lineage tracking experiments using homing CRISPR-barcoded HEK293FT cell line and mouse intestinal organoids (MARC1;Cas9), where the hierarchy of the cultures are known through passage sampling. Similar lineage trees are observed from both bulk DNA and bulk hgRNA barcodes in this experiment (bottom). Cell lines were passaged after 1 week, whereas organoids were passaged after 3 days. (e) Overview of single-cell experiment using NSC-seq platform simultaneously capturing both gRNA and mRNA within the same droplet. Custom hydrogel beads are designed for NSC-seq experiment using inDrops61. See supplemental table 1 for primer sequences. (f) Workflow delineating two separate library preparations (gRNA and mRNA) of NSC-seq. (g) Different cDNA size selection approaches yield varying sgRNA capture efficiencies. The use of two separate library preparation approaches in (f) results in improved capture efficiency. (h) Comparative transcriptome (mRNA) capture efficiency between inDrops and NSC-seq experiments (see Fig. 1d and supplemental method). Schematic in a adapted from ref. 62, Springer Nature America, and schematics in a, b, d, e, and f created using BioRender (https://BioRender.com).

