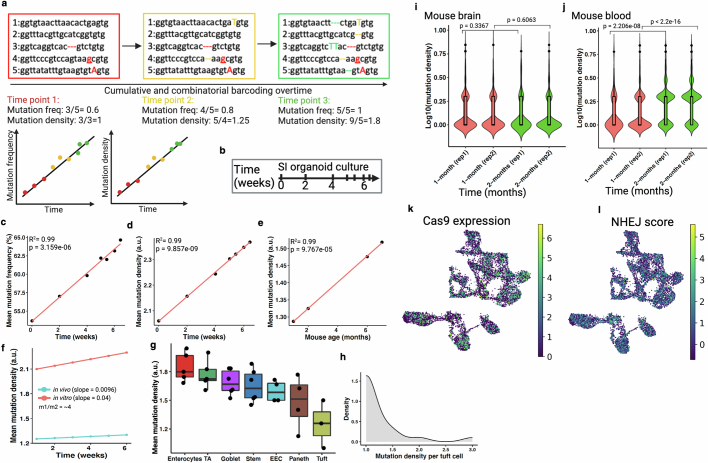
Extended Data Fig. 2. Overview of temporal recording.
(a) Schematic representation of increasing mutation density and mutation frequency overtime in self-mutating CRISPR system5,20. Mutation frequency denotes the proportion of wild-type barcodes at a given time. Mutation density is the number of unique mutations per mutated barcode. Color indicates different timepoints. Insertion (capital), deletion (dotted line) and base substitution (underline) mutations are shown here. Theoretical expected mutation frequency and mutation density are function of time (bottom). (b) Schematic of in vitro small intestinal (SI) organoids culture over 6 weeks and subsampled to analyze accumulative mutations. (c-d) Mutation frequency and mutation density exhibit a linear increase overtime. (e) Mutation density from adult mouse duodenum (SI) displays a linear increase overtime (in vivo). Pearson’s coefficient of determinant (R2) and p value (by F-test) are indicated in c-e. (f) Comparative mutation density increases in mouse SI between in vivo and in vitro. Values derived from previous linear model (d and e) to plot under same coordinate. Slope (m) indicates relative rate of cell division. In vitro cell division rate in intestinal organoids is almost 4 times higher than the in vivo intestinal epithelial cell division. (g) Comparative cell division (mutation density) across different small intestinal epithelial cell types (see Extended Data Fig. 11i). Here, each dot is a technical replicate (NSC-seq library) from the same mouse. Box plots show the median, box edges represent the first and third quartiles, and the whiskers extend to a maximum and maximum of 1.5*IQR beyond the box. TA, Transit-amplifying; and EEC, enteroendocrine; Stem, CBC. These data support the expected notion that enterocyte turnover is higher than Paneth cells. (h) Distribution of mutation density per tuft cell reflects only a small fraction of this cell type shows turnover signature, as reported before63. (i-j) Comparative mutation density between cycling (blood) and non-cycling/less-cycling (brain) tissue types over two time points. These data support that increasing mutation density is cell division dependent. Here, rep1 and rep2 are independent biological replicates and bulk DNA barcode-based mutation density assessment. Box plots inside the violin show the median value (thick line), box edges represent the first and third quartiles. P value from unpaired two-tailed t-test. (k) Cas9 expression is uniform across embryonic cell types (E7.75 and E8.5). (l) Nonhomologous end joining (NHEJ) activity score is also uniform across cell types. Panel a and b created using BioRender (https://BioRender.com).

