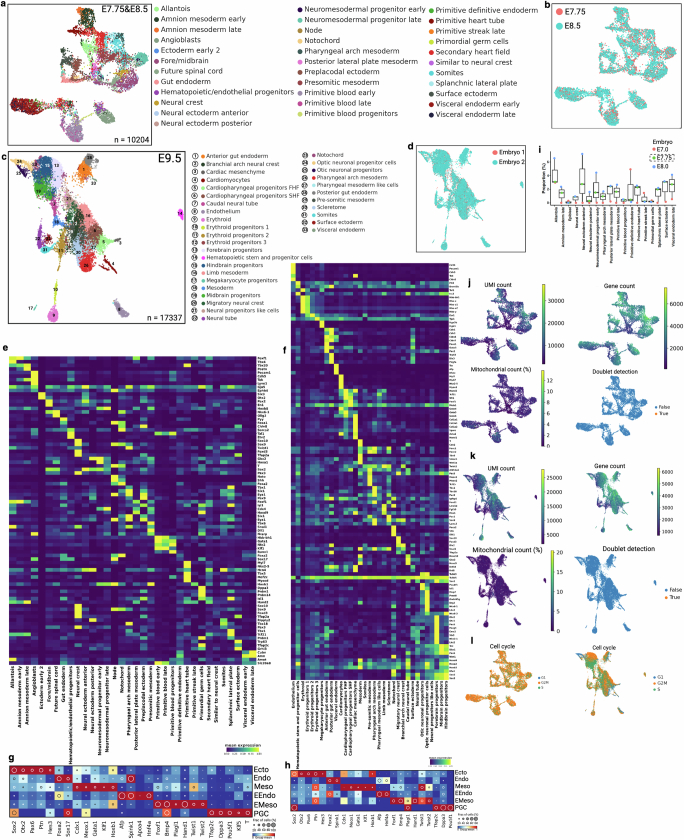
Extended Data Fig. 4. Cell-type annotation and data quality control metrics for mouse embryos.
(a) Uniform manifold approximation and projection (UMAP) embedding shows cell populations from two embryos. Cells are colored by annotated cell types. See supplemental note for embryonic cell type annotation. (b) Cells are colored by two embryonic time points. (c) UMAP embedding of two E9.5 embryos and cell type annotation. (d) Cells are colored by embryo number. (e-f) Heat map of mean expression of selective marker genes (y axis) for each cell type (x axis). Counts are normalized to median library size and log transformed. Separate heatmaps e and f are corresponding to a and c, respectively. (g-h) Dot plots of representative germ layers specific marker genes. Annotated cell types are grouped into germ layers for E7.75&E8.5 (g) and E9.5 (h) embryos. The size of the circle denotes the fraction of marker-positive cells, and color intensity indicates normalized group mean. (i) Box plots representing tissue proportions from E7.0, E7.75, and E8.0. Only E7.75 embryo is from this study. The proportion of shared selective cell types from wild-type embryos (E7.0 and E8.0) are calculated from GSE122187. Box plots show the median (n = 3 embryos), box edges represent the first and third quartiles, and the whiskers extend to a minimum and a maximum of 1.5 × IQR beyond the box. (j-k) UMAP plots are colored by unique molecular identifiers (UMIs), number of unique genes detected per cell, percentage of mitochondrial gene counts per cell, and predicted doublet score (Scrublet)68. See supplemental method and GitHub section for further data filter and quality control approaches. (l) UMAPs represent cell cycle status.

