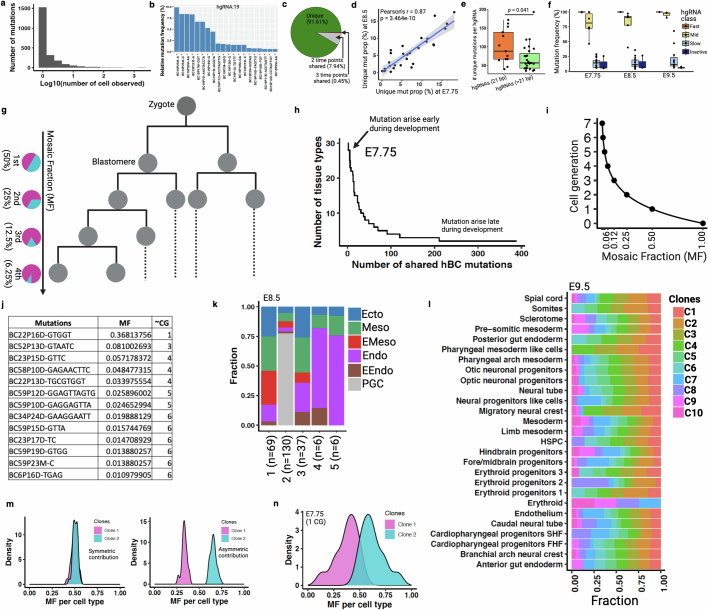
Extended Data Fig. 5. Temporal recording reveals asymmetric contribution of early embryonic clones to germ layers and tissue types.
(a) The histogram represents the number of cells in which each mutant allele is observed across three embryonic time points (3-ETP). (b) The top mutation frequency distribution is shown from a representative 21 bp long barcode of two E9.5 embryos. The mutation code along the x-axis is as follows: barcode number (BC), barcode position (P), mutation type (insertion, I; deletion, D; mismatch, M), and mutated base(s). (c) Proportion of shared and unique mutations across 3-ETP. (d) Scatter plot shows the proportion of unique mutations within each annotated cell types between E7.75 and E8.5 embryos. Pearson’s correlation (r) and p value (by F-test) are indicated. Shaded area indicates 95% confidence intervals of the regression line. See Extended Data Fig. 4 for cell type annotation. (e) Relatively fast mutation accumulation in small length hgRNAs, as reported before21. Data points are calculated from 3-ETP; p value is derived from unpaired two-tailed t-test. (f) Average hgRNA activity across time points. Box plots in e and f show the median, box edges represent the first and third quartiles, and the whiskers extend to a minimum and a maximum of 1.5 × IQR beyond the box. (g) A phylogenetic tree schematic represents early embryonic development. Mosaic fraction (MF) of somatic early embryonic mutations (EEMs) that are found across all three germ layers tracks cell generation (CG) stage32,69. MF represents the fraction of single cells that carry a certain mutation. (h) Distribution of hgRNA mutations that are shared between ≥ 2 tissue types at E7.75. The earlier a mutation arises during development; the more tissue types would share that mutation. (i) Relationship between MF and CG (. (j) EEMs and corresponding approximate CG for E7.75 embryo. Due to possible dropout in single-cell mutation detection, CG was assigned to the next closest CG stage as shown in i. (k) Unequal contribution of EEMs towards specific germ layers at E8.5. (l) MF distribution of 10 EEMs (found in >50% of tissue types) showing unequal contributions to specific tissue types at E9.5. The fraction of cells in each tissue contributed by clones C1 to C10 normalized by summing to 100%. (m) Simulated data representing symmetric (left) and asymmetric (right) contribution of first two clones (blastomeres) to tissue types during embryogenesis. (n) Asymmetric contribution of first two clones calculated from E7.75 embryo (Fig. 2c). Panel g created using BioRender (https://BioRender.com).

