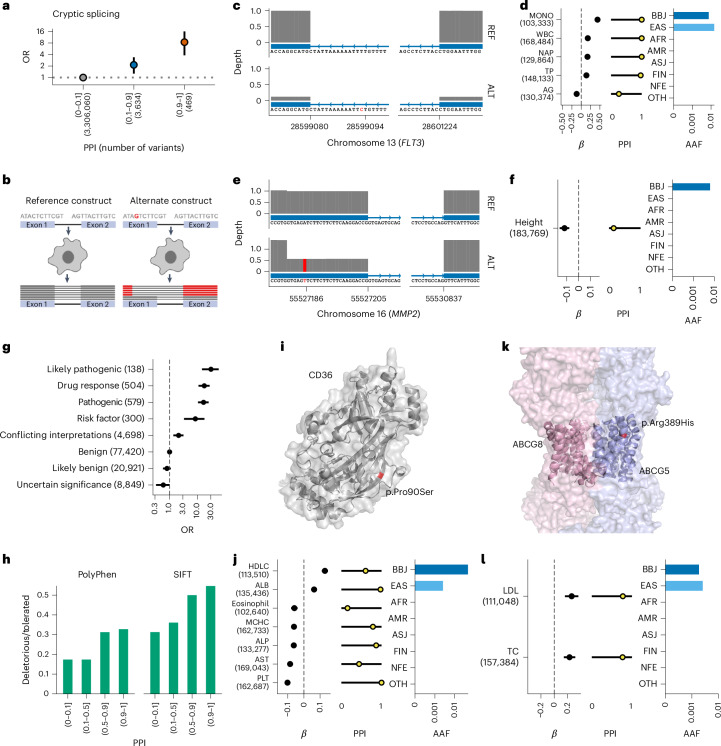
Fig. 3. Rare population-specific putative causal splice variants and pathogenic variants associated with human quantitative traits.
a, Enrichment of putative cryptic splice variants among variants with high PPI. The vertical axis indicates the OR and 95% CI of the cryptic splice variants (Splice-AI delta score > 0.2) for each PPI bin (the horizontal axis) to the lowest PPI bin. The OR and 95% CI were estimated using a Fisher’s exact test. The number of variants included in the analysis is shown after the PPI bins. b, Schematic representation of the in vitro splicing assay. c–f, Schematic representation of alternative splicing, effect size, PPI and population frequency of the cryptic splice variant rs76080105 (FLT3, c,d) and rs141440582 (MMP2, e,f). The error bar for the β estimates indicates the 95% CI. The number of individuals included in the analysis is shown after the trait names. The horizontal axes indicate the genomic coordinate. The vertical axes indicate the exon coverage of the RNA sequence from the reference construct (top) and the alternate construct (bottom). Variant sites are indicated in red. g, Enrichment of ClinVar variants among variants with a high PPI. The vertical axis indicates the categories in ClinVar. The horizontal axis indicates the OR of a high PPI using benign variants as reference and the 95% CI estimated using a Fisher’s exact test. The number of variants included in the analysis is shown after the variant annotations. h, Fraction of deleterious to tolerated variants evaluated using PolyPhen or sorting intolerant from tolerant (SIFT) in each PPI bin (horizontal axis). i, Schematic representation of the CD36 locus where rs75326924 is located. j, β estimates, PPI and AAF of rs75326924. k, Schematic representation of the ABCG5 locus where rs119480069 is located. l, β estimates, PPI and AAF of rs119480069. The AAF was obtained from the gnomAD dataset. The number of individuals included in the association analysis is found in Supplementary Table 1; the abbreviations for the phenotypes are found in Supplementary Table 2.

