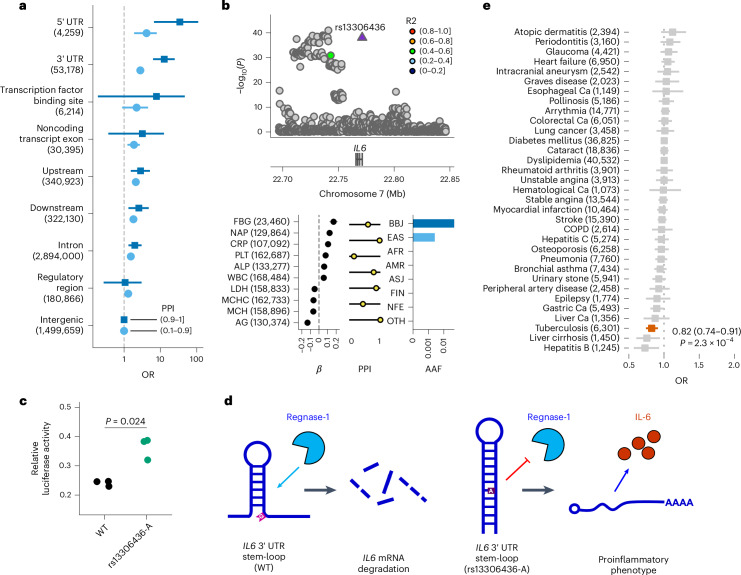
Fig. 4. Enrichment of putative causal noncoding variants for functional annotations and a new mechanism of causal variants in 3′ UTR.
a, Enrichment of causal noncoding variants for functional annotations. Each point and error bar indicates the OR of variants with a high PPI ((0.1, 0.9] or (0.9, 1]) and the 95% CI, respectively. The 95% CIs were estimated using a Fisher’s exact test. b, Regional association plot and strong associations of the IL6 locus. The horizontal axis indicates the genomic coordinates and the vertical axis indicates a negative log10(P). Statistical significance was tested using a linear mixed model. The displayed P values are two-sided and were not adjusted for multiple testing. The β estimate, PPI and AAF in the global population of rs13306436 are shown. The error bar for the β estimates indicates the 95% CI. The number of individuals included in the analysis is shown after the trait name. c, rs13306436 showed resistance to regnase-1-mediated inhibition of a IL6 3′ UTR reporter. Overexpression of regnase-1 (10 ng per well) decreased expression of the reporter harboring the IL6 3′ UTR of both the wild-type (WT) (G) and variant (A) alleles of rs13306436, but the variant (A) allele of rs13306436 exhibited less of a decrease. The results are representative of experiments carried out in triplicate. Statistical significance was assessed using two-sided t-test. d, Working hypothesis of rs13306436 altering the posttranscriptional regulation of IL6 expression. Regnase-1 recognizes the stem-loop structure within the 3′ UTR of IL6 and leads to mRNA degradation. rs13306436 is located close to the stem-loop sequence; the variant (A) allele is more structured, which might suppress regnase-1-mediated degradation, thereby making the mRNA more stable (Supplementary Note 6.3). Short transcripts indicate degraded ones. e, OR for 29 diseases among carriers of rs13306436 in unrelated BBJ participants. Case counts are shown after the outcomes (nTotal = 169,020). The squares indicate the OR; the error bars indicate the 95% CI. Statistical significance was tested using a logistic regression with a two-sided test at P < 0.05/29. The displayed P values were not adjusted for multiple testing. The AAF was obtained from the gnomAD dataset. The number of individuals included in the association analysis is found in Supplementary Table 1; the abbreviations for the phenotypes are found in Supplementary Table 2.

