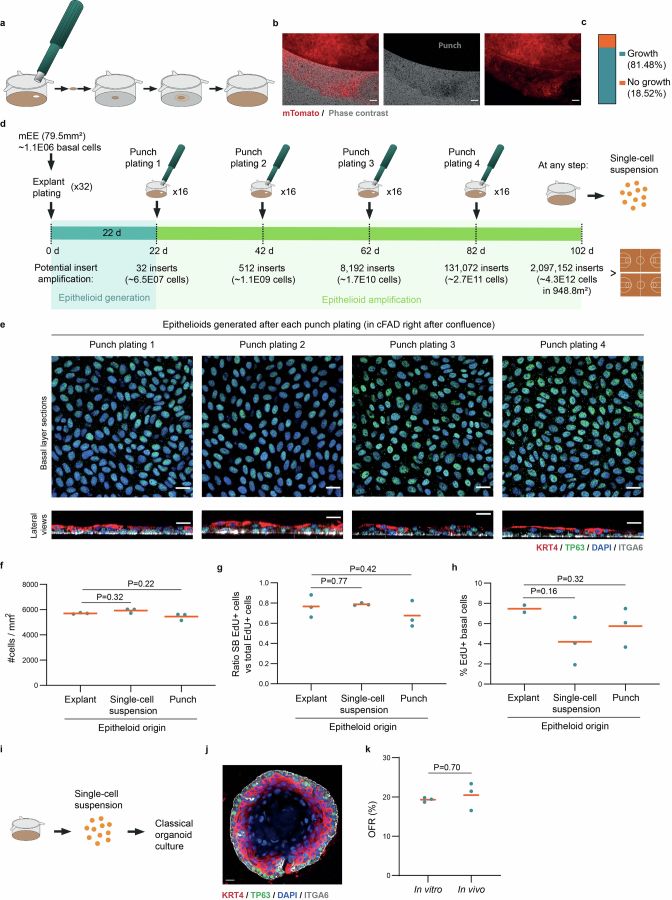
Extended Data Fig. 2. Amplification of mouse esophageal epithelioids.
a, Scheme of the punch plating procedure. b, Epifluorescence microscopy images showing a front of Rosa26mTmG cells exiting a punch to colonize the insert. Phase contrast (grey) and mTomato (red). Scale bar, 100 μm. Image representative of 9 independent experiments. c, Proportion of epithelioid punch biopsies able to generate new cultures, n = 9 independent experiments. d, Protocol for punch plating amplification. e, Optical sections of basal cell layer (top panels) and lateral views (bottom panels) from confocal 3D image stacks of epithelioids stained for TRP63 (green), KRT4 (red), ITGA6 (grey) and DAPI (blue). Scale bars, 20 μm. f-h, Epithelioids generated from explants, single-cell suspensions, or punch biopsies from epithelioids (Punch plating 1) incubated for 2 weeks after confluence and the last 3 hours with 10 µM EdU. Cell density in the basal layer (f), stratification ratio (g, percentage of EdU+ suprabasal cells versus total EdU+ cells 96 h after EdU pulse) and the proportion of EdU+ basal cells immediately after the 3 h EdU pulse (h). Each dot corresponds to a biological replicate (epithelioid from a different mouse). n = 3. Orange lines indicate average. Two-tailed paired (f-g) or two-tailed unpaired (h) Student’s t-test. i-k, Organoid generation from epithelioids. Protocol (i), representative image of esophageal organoid (j) stained for ITGA6 (grey), KRT4 (red), TP63 (green) and DAPI (blue), scale bar=14 μm, and organoid formation rate (OFR, %) (k) from esophageal epithelioids and mouse esophagus. n = 3 replicates from different original epithelioid cultures or mice. Orange bars indicate mean values. Two-tailed Mann-Whitney test.

