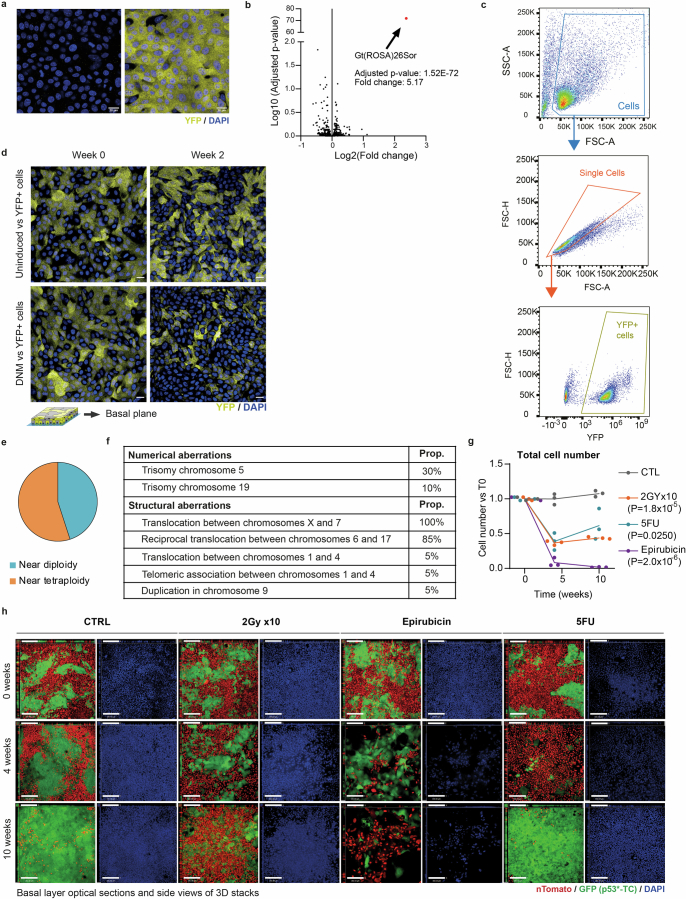
Extended Data Fig. 5. Epithelioids as a tool to study cell competition.
a, Uninduced (left, YFP-) or induced (right, YFP+) cells from mouse esophageal epithelioids from Rosa26YFP/YFP mice. Scale bar, 20 μm. b, Volcano plot comparing RNA expression (Log2 of the fold change) of induced and uninduced cells from a and log10 of adjusted p-value (corrected for multiple testing using the Benjamini and Hochberg method) after dSeq2 differential expression analysis. Red dot shows the only significant gene. Wald test corrected for multiple testing using the Benjamini and Hochberg method. c, Gating strategy for quantifying the YFP+ cell population in cell competition experiments with YFP+ and non-fluorescent subpopulations shown in Fig. 5. d, Optical sections of basal cell planes at 0 and 2 weeks of competition of conditions shown in Fig. 5e, Scale bar, 20 μm. e-f, M-FISH karyotyping analysis of p53R245W mutant cancer cells (p53*-TC) used in Fig. 5. g, Effect of each treatment on cell numbers (including wt and p53*-CCL cells) relative to T0. n = 3 independent cultures. P-values indicate comparison between each treatment and control at the 10-week time point. Unpaired two-sided Student’s t-test. h, Images shown in Fig. 5i–l with their corresponding panels of DAPI channel in blue. Scale bars, 80 μm.

