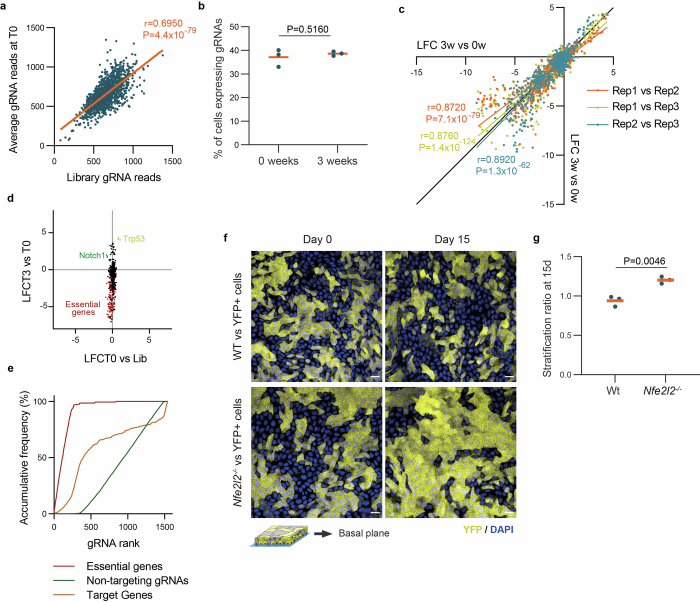
Extended Data Fig. 6. CRISPR/Cas9 fitness screen validation.
a, Correlation between normalized read counts of the plasmid library and average gRNA reads at the initial time point (T0). The orange line shows the linear regression between samples with the Pearson’s coefficient and two-tailed p-value of the correlation. b, Proportion of cells expressing the BFP reporter present in the gRNA plasmid at the initial time point (0 weeks) and late time point (3 weeks). Every dot corresponds to a biological replicate. Orange bars show mean values. Unpaired two-sided Student’s t-test, n = 3 biological replicates. c, Correlation between the log fold changes (LFC) between 3 weeks and 0 weeks of each biological replicate (Rep 0, Rep1 and Rep2). Each color represents the correlation between a pair of biological replicates. The colored lines show the linear regression between samples with the Pearson’s coefficient and two-tailed p-value of the correlation. Black line indicates the identity line. d, Correlation of LFC between 0w and gRNA library and the LFC between 3 weeks and 0 weeks, for each biological replicate and gRNA. gRNA targeting essential genes are highlighted in red and gRNA targeting Notch1 and Trp53 in green and yellow respectively. e, Area under the curve analysis for the non-targeting gRNAs, gRNAs targeting essential genes and the rest of gRNAs used. f-g, Primary cells from wild type or Nfe2l2−/− cells, were mixed with YFP+ cells and kept for 15 days in culture. Optical sections of the basal cell plane at 0 and 15 days of competition (f, Scale bar, 20 μm) and stratification ratio of wild type and Nfe2l2−/− cells at day 15 (g, n = 3). Replicates correspond to primary cultures from different animals. Orange bars show mean values. Unpaired two-sided Student’s t-test.

