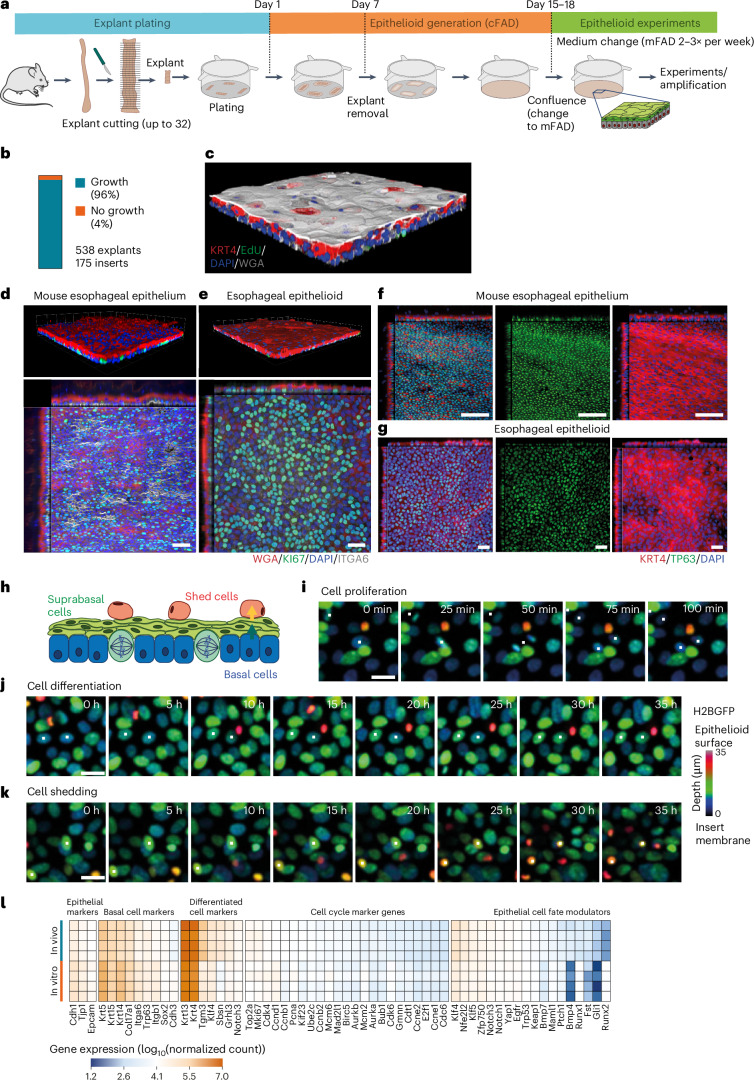
Fig. 2. Characterization of mouse esophageal epithelioids.
a, Protocol. The mouse esophagus is opened longitudinally, cut into 32 pieces and 4 pieces are plated per insert. Once large cellular outgrowths are formed (day 7), the explants are removed. Once the culture is confluent, the medium is changed to mFAD. One week later cultures are ready for experimental use and are maintained by changing the medium two or three times a week. b, Proportion of explants that form epithelioids (n = 538 explants from 33 mice plated in 175 inserts by 5 different researchers). c, Rendered confocal z-stack of a typical confluent epithelioid after 1 h incubation with EdU and stained for KRT4 (red, suprabasal cells), WGA (gray), EdU (green, proliferating cells) and DAPI (blue). d,e, Rendered confocal z-stack (upper) and basal layer optical section with orthogonal views (lower) of typical esophagus whole-mount (d) (scale bar, 41 μm (x–y, main panel, top down view) and 32 μm (z, inset, side view)) and esophageal epithelioid (e) (scale bar, 38 μm (x–y) and 16 μm (z)) stained for ITGA6 (gray), KI67 (green), WGA (red) and DAPI (blue). f,g, Basal layer optical section with orthogonal views (lower) of a typical esophagus whole-mount (f) (scale bar, 40 μm (x–y) 24 μm (z)) and esophageal epithelioid (g), scale bar, 38 μm (x–y) and 15 μm (z), stained for TP63 (green), KRT4 (red) and DAPI (blue). Images typical of esophagi from three mice and three epithelioid cultures derived from three mice. h–k, Confocal live imaging of H2BGFP-expressing epithelioids showing multiple z-projection time frames labeled with a rainbow color scale, where color indicates the cell position in the z plane. h, Scheme of the esophageal epithelioid structure with the z-scale color labeling used in i–k, with basal cells (blue), suprabasal cells (green) and shedding cells (red). Selected live images showing cells undergoing mitosis (i), differentiation (j) and shedding (k) from Supplementary Videos 3–5, respectively. Time is indicated in each frame. Scale bar, 20 μm. The cells shown are representative examples of four imaged regions each from two independent epithelioid cultures. l, RNA-seq comparing gene expression from mouse esophageal epithelium (in vivo) and esophageal epithelioids 1 week post confluence and cultured in mFAD (in vitro). n = 4 animals and 4 epithelioids from 4 different animals. Heatmap shows selected basal cell, differentiation, cell cycle and cell fate modulator transcripts45.

