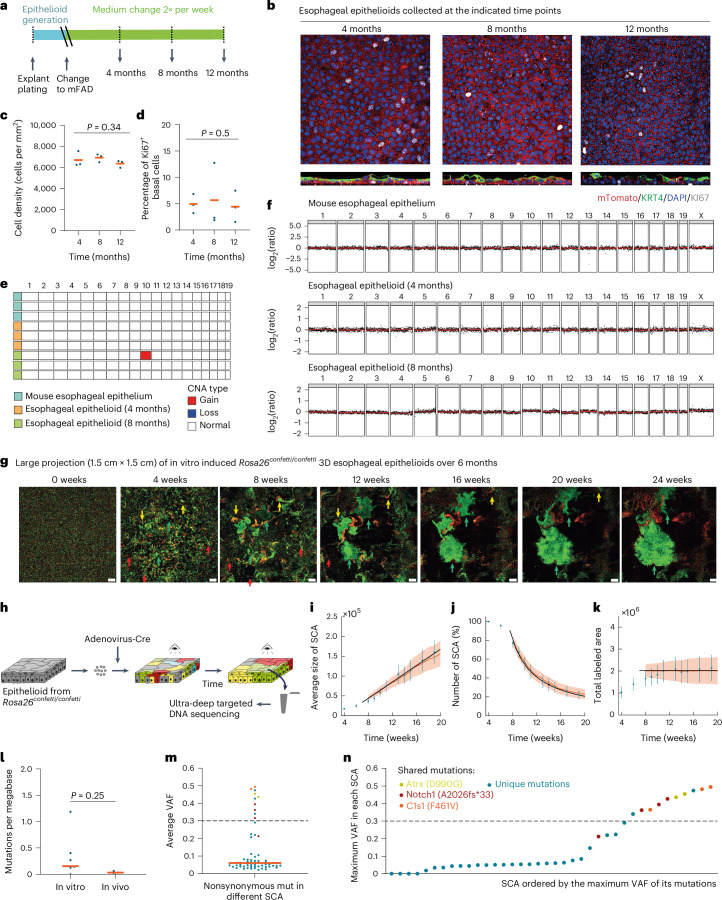
Fig. 5. Long-term maintenance and tissue dynamics of esophageal epithelioids.
a–d, Esophageal epithelioids generated from Rosa26mTmG mice maintained without passaging for up to 12 months and stained for KI67 (gray, proliferating cells), KRT4 (green, differentiated cells) and DAPI (blue). Protocol (a) and optical confocal section (b) of the basal cell layer (upper), lateral views (lower). Scale bar, 20 μm. Cell density (c) and the proportion of KI67+ basal cells (d). Lines indicate mean values, n = 3 inserts from different animals per time point. Page’s L test. e,f, Whole-genome sequencing of mouse esophageal epithelium and epithelioids after 4 and 8 months in culture. n = 3 animals and 3 esophageal epithelioids from different animals per time point. Summary plot showing all gain and loss of chromosome regions that affect more than 20% of cells (e) and copy number profile (f). g–k, Epithelioids from Rosa26confetti/confetti mice cultured for 24 weeks after in vitro Cre recombination (Methods). g, Representative images of the same region of an epithelioid at the indicated time points. Scale bar, 1 mm. Red arrows indicate shrinking SCA, yellow arrows indicate SCA with biphasic growth and green arrows indicate growing SCA. h, Experimental protocol for g and l–n. i–k, Average SCA size (i), SCA number (j) and total labeled area (k) with experimental values (blue, mean ± s.d.) and a theoretical, single-parameter fit (black) as well as lattice-based simulations (orange) of a single-progenitor model. n = 351 SCA from 9 epithelioids from 6 different animals. l–n, Thirty-eight surviving SCA were collected by laser-capture microdissection and DNA was sequenced. The estimated mutation burden of the collected SCA (in vitro) and three control mice samples (in vivo) (l), average VAF of nonsynonymous mutations in different SCA (m) and SCA ordered by the maximum VAF of its mutations, mutations represented in more than one sample are highlighted in the specified colors shown (n). Orange bars indicate mean values, and dashed lines indicate a VAF threshold for clonal mutations in the sample. Unpaired two-sided Student’s t-test.

