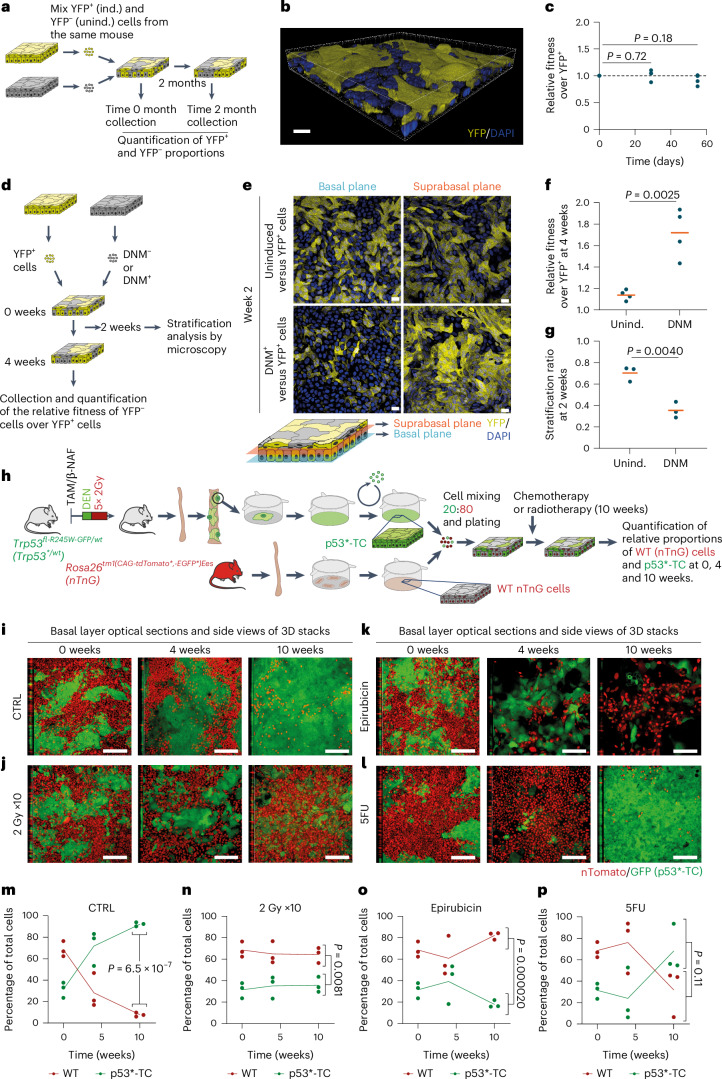
Fig. 6. Epithelioids as a tool to study clonal competition.
a–c, Cell competition in mixed epithelioid cultures formed by induced (ind.; YFP+) and uninduced (unind.; YFP−) Rosa26YFP/YFP cells was maintained for 2 months. a, Protocol. b, Rendered confocal z-stack of a typical epithelioid with both competing subpopulations. c, Relative fitness of YFP− versus YFP+ cells at different time points. n = 4 inserts per time point from 4 mice. Unpaired two-sided Student’s t-test. d, Protocol for DNM and wild-type (WT) cell competition. Primary cells from R26flDNM mice epithelioids, uninduced (wild-type, DNM−) or induced (DNM+) in vitro, were mixed with YFP+ cells and kept in culture. e, Optical sections of basal and suprabasal cell planes at 2 weeks of competition of conditions shown in d. Scale bar, 20 μm. f,g, Relative fitness over YFP+ cells (f, n = 4) at 4 weeks and stratification ratio of DNM− and DNM+ cells at 2 weeks (g, n = 3). Replicates correspond to primary cultures from different animals. Orange lines show mean values. Unpaired two-sided Student’s t-test. h–p, Co-culture of transformed and wild-type cells. h, Protocol to generate Trp53 mutant transformed cells (p53*-TC). i–l, p53R245W mutant esophageal tumors were generated and expanded using the epithelioid protocol (Methods) to obtain p53*-TC. p53*-TC were mixed with primary wild-type cells from Rosa26nTnG (nuclear Tomato, nuclear green fluorescent protein) mice (20:80, respectively) (i) and exposed to 10 weeks of weekly dosing with 2 Gy gamma-irradiation (j), 1 µM epirubicin (k) or 5 µM 5FU (l). Orthogonal views of basal layer optical sections of z-stacks at 0, 4 and 10 weeks of treatment. Scale bar, 80 μm. m–p, Proportion of each subpopulation over time: control (m), 2 Gy gamma-irradiation (n), 1 µM epirubicin (o) and 5 µM 5FU (p). n = 3. Replicates and lines connecting mean values are shown. P values indicate comparison between subpopulations at the 10-week time point. Unpaired two-sided Student’s t-test. β-NAF, beta-naphthoflavone; TAM, tamoxifen.

