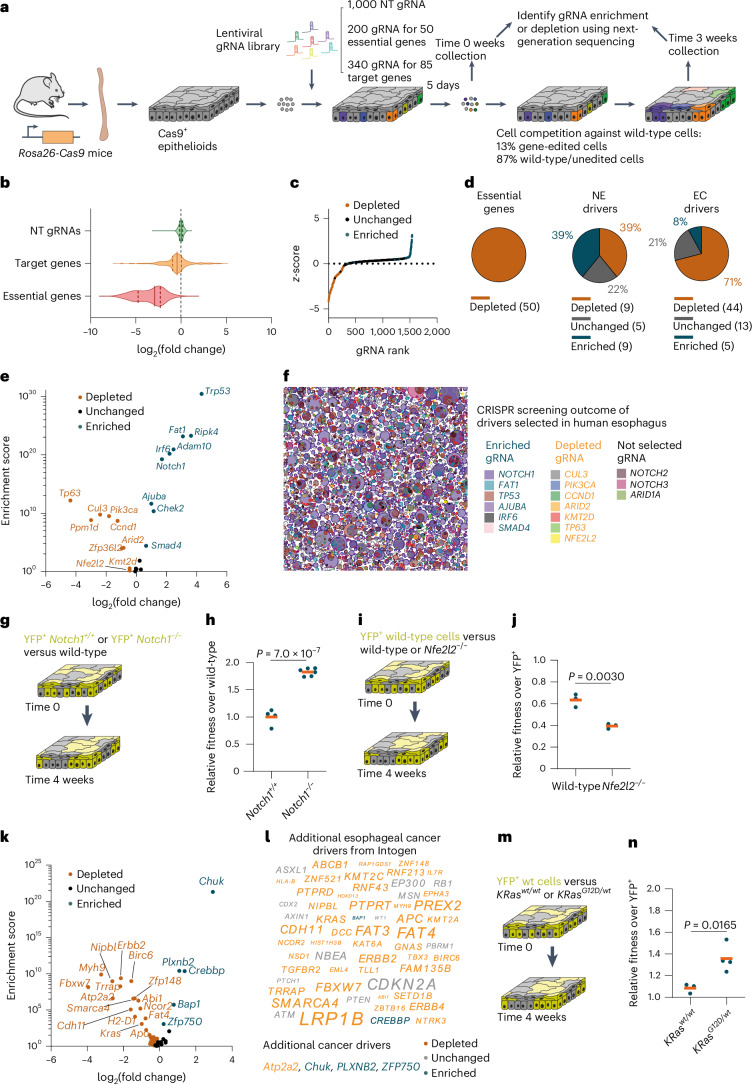
Fig. 7. CRISPR–Cas9 cell fitness screen identifies additional drivers of clonal expansion.
a, Protocol for the CRISPR–Cas9 targeted cell fitness screen. n = 3 biological replicates from different animals. b, Violin plots showing the distribution of log2(fold change) of gRNAs targeting essential genes (red), known or putative clonal expansion drivers (orange) and NT gRNAs (green), between the 3 and 0 week time points. c, The z-score is plotted against gene rank with each dot corresponding to a gRNA. gRNAs targeting significantly depleted genes are shown in orange and those targeting significantly enriched genes are shown in blue. d, Proportion of significantly enriched (blue), depleted (orange) or unchanged (gray) genes for essential genes (left), known clonal expansion drivers (NE, middle) or putative esophageal cancer drivers (EC, right). Gene numbers and proportions are shown. e, Volcano plot of the log2(fold change) versus enrichment score for known positively selected mutant genes in normal esophagus. f, Schematic representation of positively selected mutant clones in normal human esophagus from donors aged between 44 and 75 years29. Depleted, unchanged and enriched targets in the screen are shown in orange, gray and blue, respectively. g,h, Protocol (g) and relative fitness over wild-type cells (h) of Notch1+/+ YFP+ cells (wt) or Notch1−/− YFP+ cells competing with uninduced cells from the same animals (wild-type cells) for 4 weeks. Dots are epithelioids from different animals. Orange bars indicate mean values. Unpaired two-sided Student’s t-test. n = 4–6 epithelioids from different animals. i,j, Protocol (i) and relative fitness over YFP+ cells (j) of wild-type or Nfe2l2−/− cells competing with YFP+ cells for 4 weeks. Dots are epithelioids from different animals. Orange bars indicate mean values. Unpaired two-sided Student’s t-test. n = 3 epithelioids from different animals. k,l, Volcano plot of log2(fold change) versus enrichment score (k) and illustration (l) of candidate esophageal cancer drivers from ref. 64. The font size in l reflects the proportion of mutant samples from ref. 64. m,n, Protocol (m) and relative fitness over YFP+ cells (n) of uninduced (KRaswt/wt) or induced (KRasG12D/wt) cells from LSL Kras+/G12D mice competing with YFP+ cells for 4 weeks. Dots correspond to epithelioids from different animals. Orange bars indicate mean values. Unpaired two-sided Student’s t-test. n = 3–4 epithelioids from different animals.

