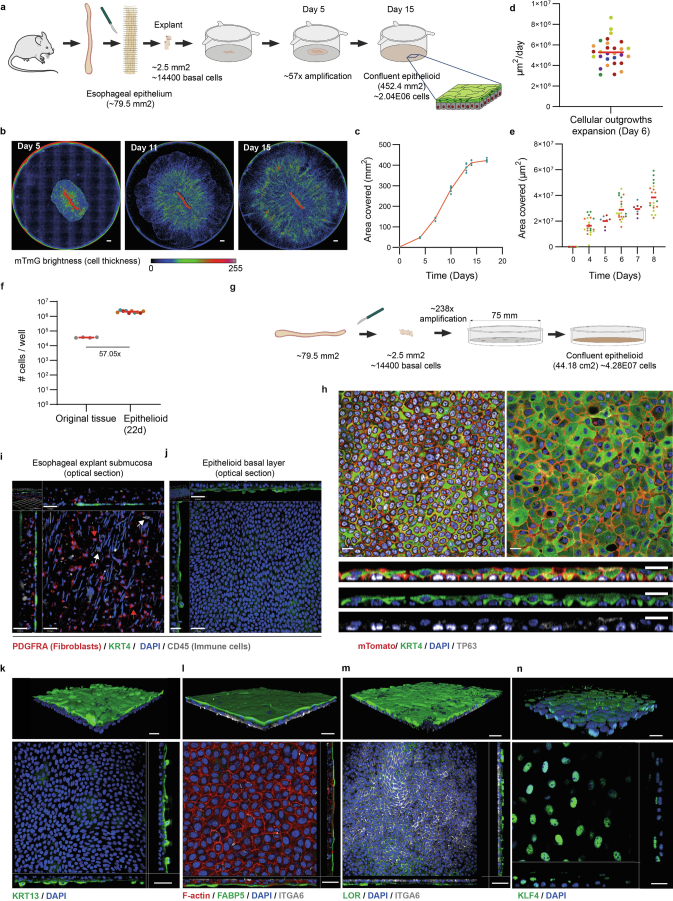
Extended Data Fig. 1. Generation of mouse esophageal epithelioids.
a, Epithelioid generation from a single esophageal explant. b, Live microscopy ‘Incucyte’ images 5, 11 and 15 days after plating Rosa26mTmG esophageal explants. Color scale shows fluorescence intensity. Scale bar, 1000 μm. Images representative of 20 independent explants. c, Area of covered by cells from a single esophageal explant. Each dot represents an epithelioid. n = 6 epithelioids. d-e, Expansion velocity at Day 6 after plating and area of cellular outgrowth 8 days after plating. Each dot represents a cellular outgrowth and each colour a different mouse (n = 29 epithelioids from 6 mice). Red bar, mean. f, Number of cells in epithelioids 22 days after plating an explant of 1/32th of esophagus (Epithelioid) compared to the basal cell number in original explant (Original tissue). Each dot represents a mouse or an epithelioid. Dots with the same color correspond to same mouse. n = 9 epithelioids from 3 mice. Red bar, mean. g Protocol: 5 explants from Rosa26mTmG mouse esophagus were plated in 75 mm diameter inserts and cultured for 20 days basal cell numbers quantified at the start and end of experiment. h optical sections of basal layer (top-left), suprabasal layer (top-right) with lateral views (bottom) of a representative area of 20 day culture from g. Grey, TP63, green, KRT4, and blue, DAPI. Scale bars, 20 μm. i and j, Immunostaining against PDGFRA (red, fibroblasts), KRT4 (green), CD45 (grey, immune cells) and DAPI (blue), of explant and surrounding cellular outgrowth. Optical section with orthogonal views of explant submucosa (I, scale bars=44 μm) and newly formed epithelioid basal layer membrane (j, scale bars=41 μm). Images representative of 3 biological replicates. k-n, Mouse esophageal epithelioids cultured in mFAD immunostained against (k) KRT13 (green) and DAPI (blue); (l) FABP5 (green), F-actin (red), ITGA6 (grey) and DAPI (blue); (m) LOR (green), ITGA6 (grey) and DAPI (blue); (n) KLF4 (green) and DAPI (blue). Scale bars correspond to 40μm (k, top panel), 30μm (k, bottom panel and l), 50μm (m) and 20μm (n). Source data in Supplementary Table 1. Images representative of 3 biological replicates.

