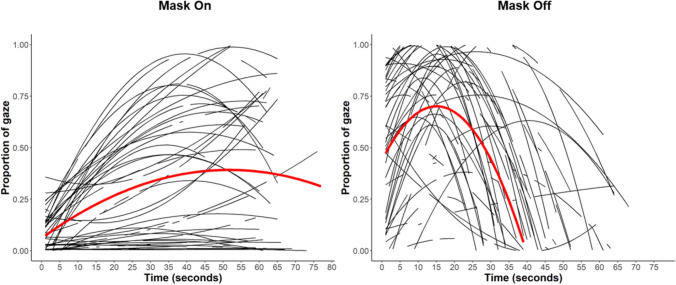
Fig. 5.
Visualization of the growth curve modeling examining attention to a stranger during the period when the stranger was wearing a scary mask (left panel) and when the stranger took off the mask. The visualizations are presented in Figs. 2 and 4 of Gunther et al. (2021). The quadratic trajectory yielded a better fit than a linear trajectory (BIC for a linear fit was 1395.65; BIC for a quadratic fit was 1324.34). The black lines show the model-estimated quadratic trajectory for individual participants. The red line displays the average quadratic trajectory

