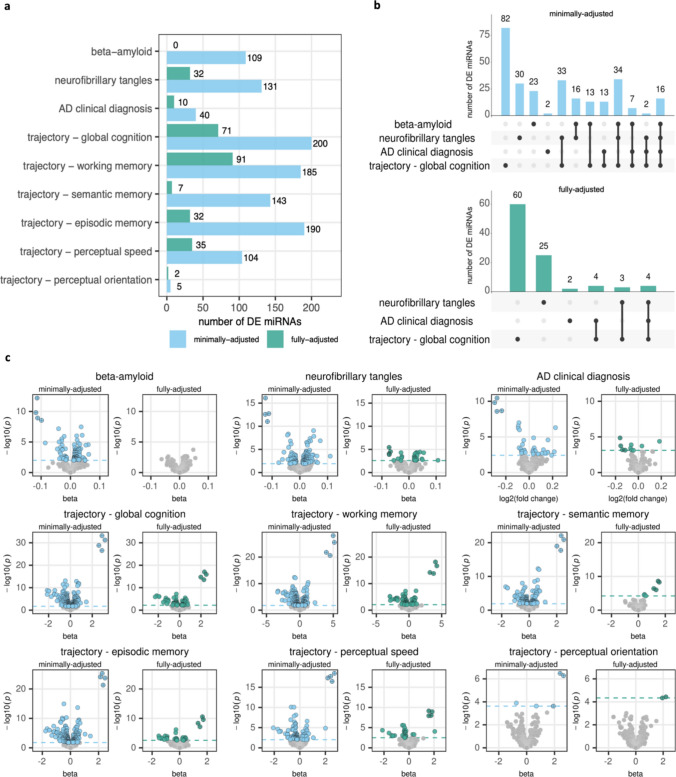
Fig. 1.
Summary of differentially expressed miRNAs from the minimally adjusted and fully adjusted models. See Table 2 for variables adjusted for in each model. a number of differentially expressed miRNAs per trait. b Upset plots for the number of DE miRNAs unique to or shared among the traits beta-amyloid, neurofibrillary tangles, AD clinical diagnosis, and trajectory of global cognition. The vertical bars show the number of DE miRNAs for the combination of traits indicated by the black circles in the matrix. Beta-amyloid had no DE miRNAs with the fully adjusted model and therefore is not included in the bottom panel. c Volcano plots for each trait. Dashed horizontal line indicates p-value corresponding to FDR < 5%. Points with gray fill indicate non-significant associations. Points with crosses indicate associations with miRNAs miR-132/212-3p/5p

