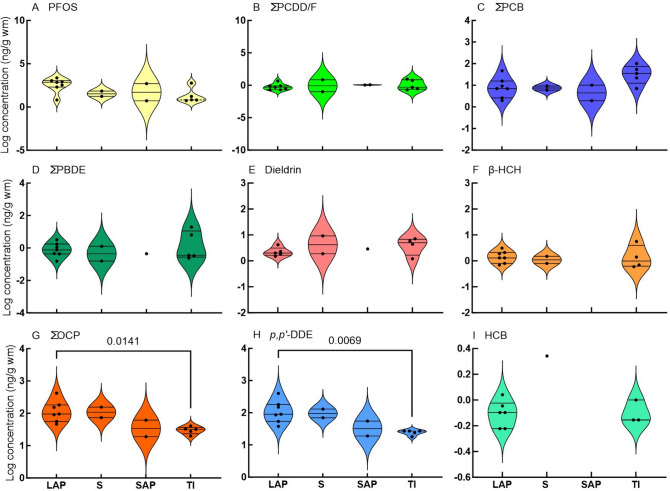
Fig. 5.
Violin plots (frequency distributions) of concentrations of selected compounds quantified in bird eggs according to feeding guilds. Horizontal lines are medians and 25 and 75% quartiles. Feeding guilds are expressed as LAP = large aquatic predators, S = scavengers, SAP = small aquatic predators, and TI = terrestrial insectivore. ANOVA p-values of guilds that were found to be statistically significant different are indicated with brackets. Two-way unpaired t-test was performed for HCB

