
Figure 8.
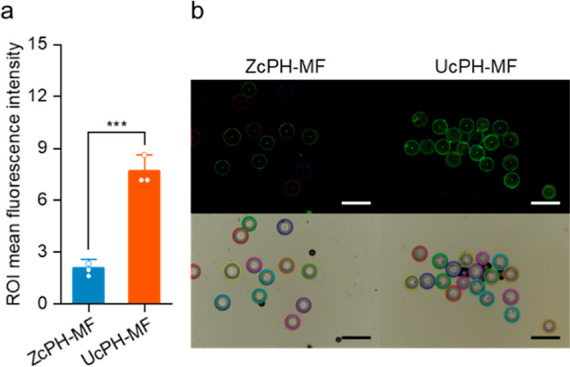
Protein adsorption properties characterized using the fluorescent protein, FITC-BSA. (a) Comparison of mean fluorescence intensities on the particle surfaces after protein adsorption [mean ± standard deviation (SD); Tukey’s test; ***p < 0.001; n = 3]. (b) Optical and fluorescence micrographs of protein adsorbed particles based on region-of-interest measurements. Scale bar, 500 μm.