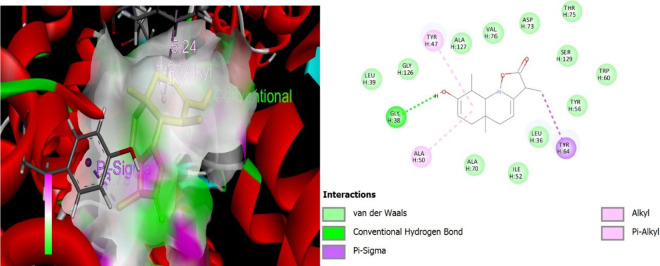
Figure 6.
Visualization of quinoline dione–protein (PDB ID 3IX4) interactions. Molecular interaction diagram of a quinoline dione with surrounding amino acid residues in a protein. The interactions depicted include van der Waals forces (green circles), a conventional hydrogen bond (green dotted line) with GLY H:38, π–σ interactions (purple dashed lines) with TYR H:47 and TYR H:64, alkyl interactions (pink circles) with ALA H:50, and π–alkyl interactions (pink circles with purple shade) with TYR H:47. The ligand is shown at the center, surrounded by the amino acid residues identified by their three-letter codes and sequence positions (e.g., GLY H:126, LEU H:39). This diagram highlights the key binding interactions between the ligand and the protein.

