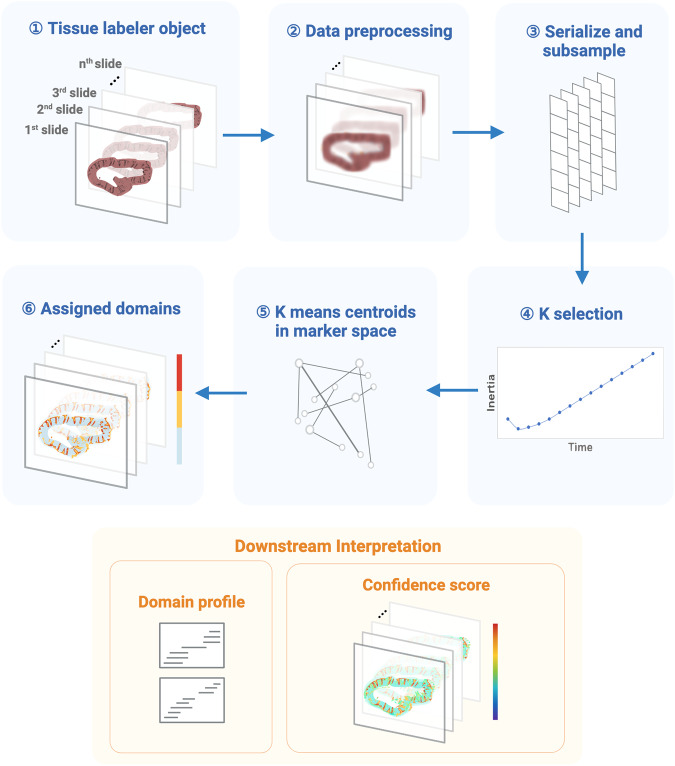
Fig. 1. The workflow of the MILWRM pipeline.
MILWRM begins with constructing a tissue labeler object from all the sample slides that undergo data preprocessing, serialization, and subsampling to create a randomly subsampled dataset used for k-means model construction. This subsampled data is used to find an optimal number of tissue domains, and k-selection using the adjusted inertia method. Finally, a k-means model is constructed, and each pixel is assigned a TD. Each TD has a distinct domain profile describing its molecular features. MILWRM also provides quality control metrics such as confidence scores (created with BioRender.com).

