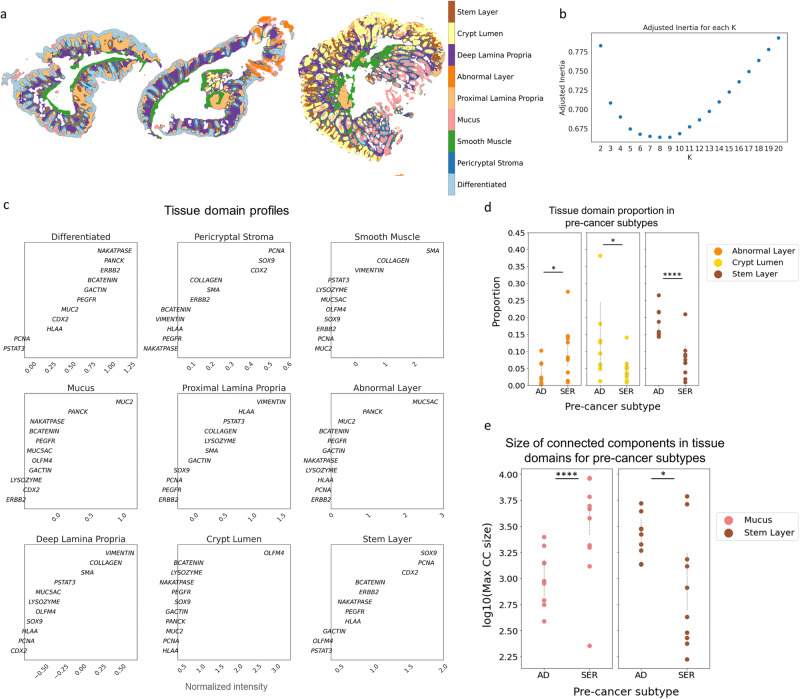
Fig. 3. MILWRM tissue domains describe the molecular distinction between human colon adenoma pre-cancer subtypes.
a Three representative colon mIF images with labeled tissue domains (α = 0.02). b Estimated number of tissue domains in adjusted inertia plot. c Domain profile describing marker composition of each TD. d Scatter plot for proportion for tissue domains that are significantly associated with pre-cancer subtypes. e Scatter plot for the log of size of maximum connected components for tissue domains that are significantly associated with pre-cancer subtypes. *Signifies a p value < 0.05 and ****signifies a p value < 0.0001.

