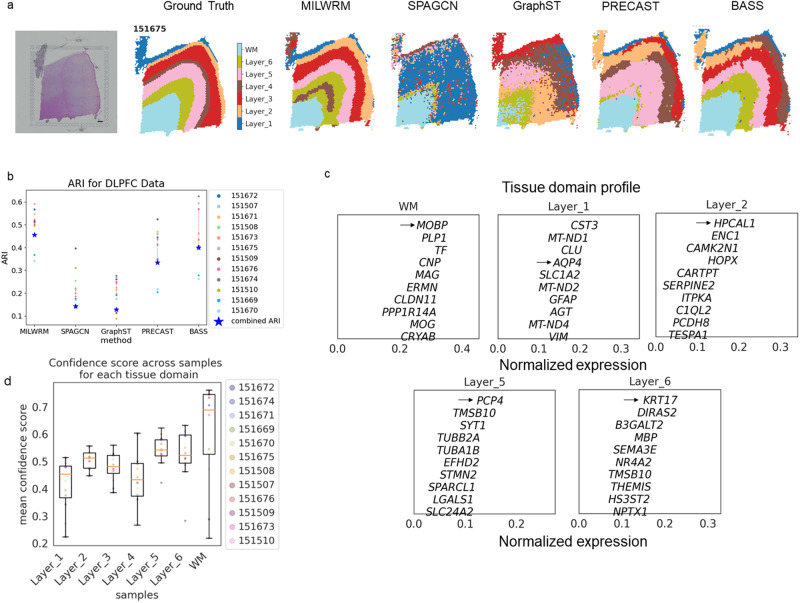
Fig. 5. MILWRM applied to annotated DLPFC ST data performs better than the state-of-the-art methods.
a DLPFC sample 151675 (scale bar = 500 µm) with ground truth, MILWRM, SpaGCN, GraphST, PRECAST, and BASS results overlaid (k = 7). b Scatter plot for ARI and consensus ARI. c TD profile describing the genes enriched in each TD. d Boxplot for average confidence score across all pixels in each image for each TD with each color dot corresponding to a sample (legend on the right).

