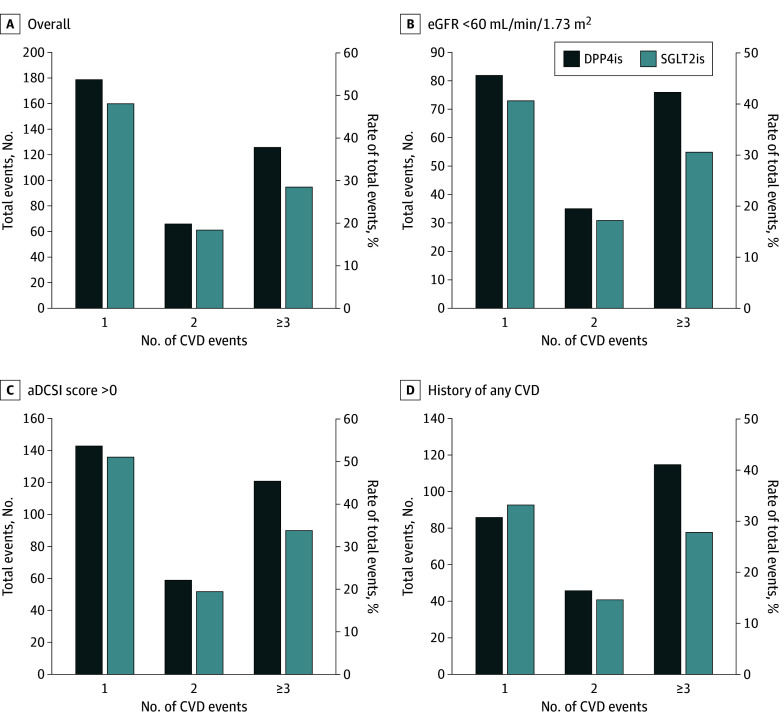
Figure 2. Distribution of Total Cardiovascular Disease (CVD) Events by Number of Events During Study Follow-Up for the Overall Cohort and 3 Subgroups.
Percentages were calculated as the number of CVD events in each category divided by the total number of CVD events in each treatment group during the follow-up period. aDCSI represents adapted Diabetes Complications Severity Index; DPP4is, dipeptidyl peptidase 4 inhibitors; eGFR, estimated glomerular filtration rate; HR, hazard ratio; and SGLT2is, sodium-glucose cotransporter 2 inhibitors.

