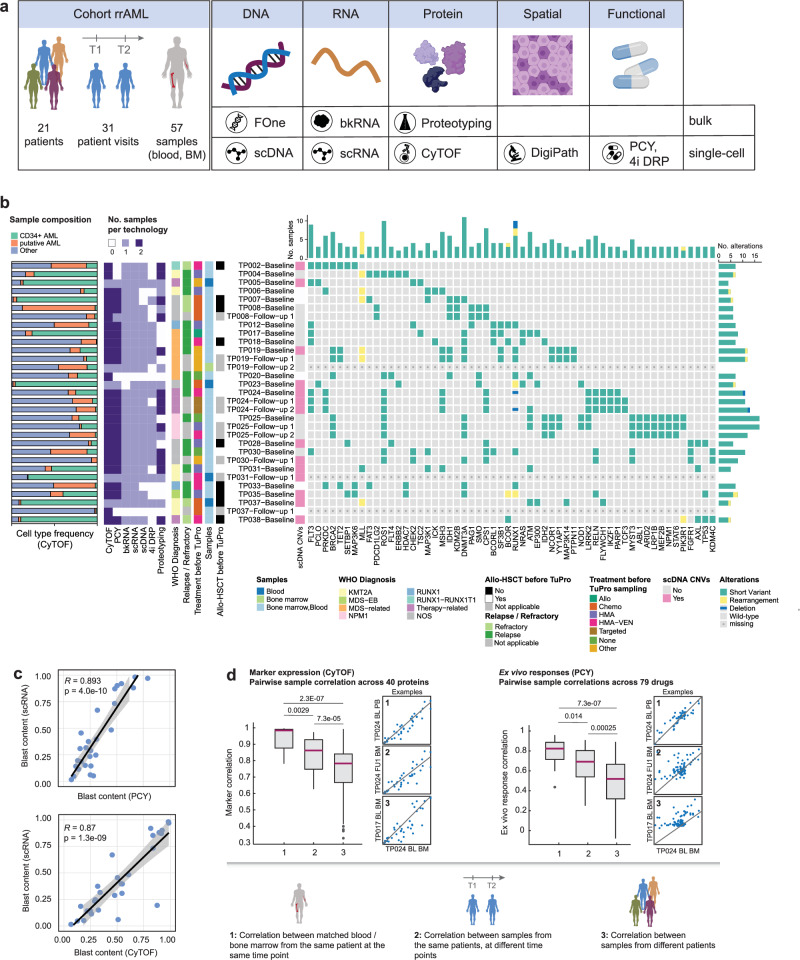
Fig. 1. Single-cell molecular and functional profiling of AML samples.
a Schematic workflow illustrating the types of analyses performed in this study. b Cohort overview. From left to right: Barplot depicting the sample composition (bone marrow; peripheral blood if bone marrow was not sampled) measured by CyTOF; the number of samples measured per technology and patient visit; clinical data; whether there were any copy number variations (CNVs) detected by scDNA; alterations measured by the FoundationOne Heme panel. Patients were diagnosed according to the WHO 2016 classification (WHO Diagnosis). NOS Not otherwise specified; MDS-EB myelodysplastic syndrome with excess of blasts; Mutated genes are indicated. c Correlation of blast fractions measured by scRNA-seq with those measured by PCY (top, n = 25 samples from 18 patients) and CyTOF (bottom, n = 27 samples from 20 patients). Pearson’s R and corresponding P values (two-sided t-test) are indicated. Lines and shaded area represent a linear regression fit and 95% confidence bands, respectively. d Correlation (Spearman) of molecular (CyTOF marker expression across 40 proteins, left) and functional (PCY ex vivo responses across 79 drugs, right) profiles between 1) pairs of matched blood/bone marrow samples from the same patient taken at the same visit (CyTOF n = 15; PCY n = 14), 2) pairs of samples from the same patient taken at different visits (CyTOF n = 26; PCY n = 26), 3) pairs of samples from different patients (CyTOF n = 820; PCY n = 663). Only samples with > 5% blast content by pathology are included in this analysis. Small scatterplots show an example pairwise comparison for each category, lines from linear regression. P values from two-sided, two-sample Wilcoxon test. Box plots indicate the median (horizontal line) and 25% and 75% ranges (box) and whiskers indicate the 1.5x interquartile range above or below the box. Outliers beyond this range are shown as individual data points. Abbreviations: T1, T2 Time point of sampling 1/2; FOne FoundationOne Heme; scDNA single-cell DNA-seq; bkRNA bulk RNA-seq; scRNA single-cell RNA-seq; CyTOF cytometry by time-of-flight; IMC imaging mass cytometry; PCY pharmacoscopy; 4i DRP iterative indirect immunofluorescence imaging drug response profiling; HMA hypomethylating agent; VEN venetoclax.

