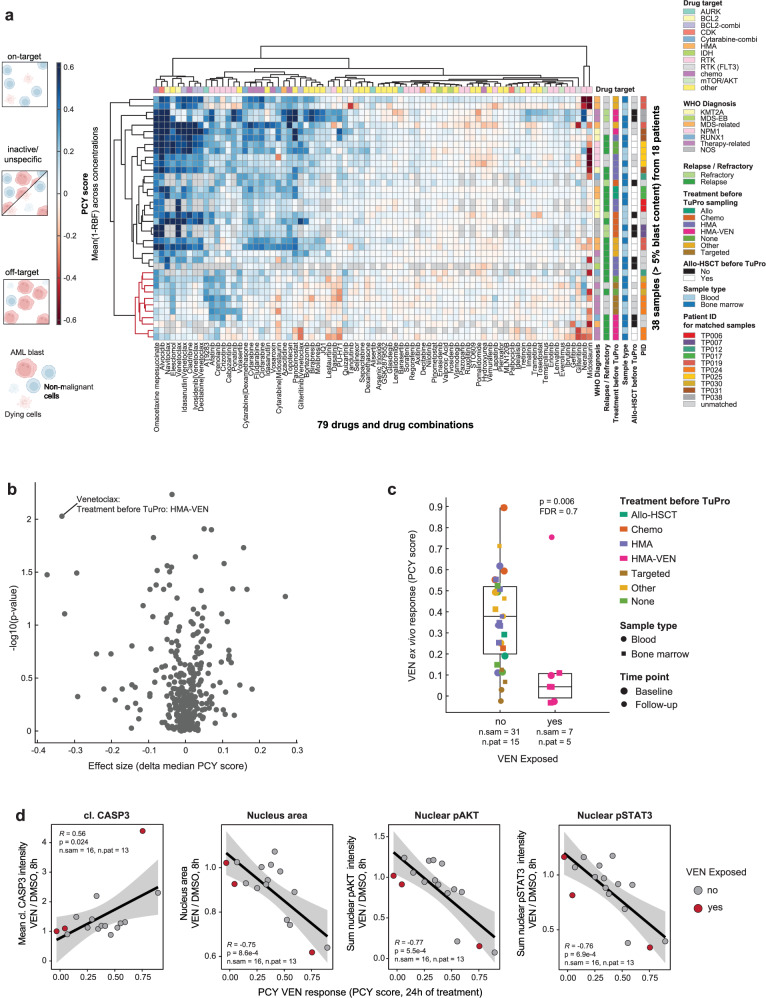
Fig. 2. The ex vivo drug response landscape of rrAML.
a Heatmap showing the PCY-based ex vivo responses (PCY scores) of 38 rrAML samples with blast content >5% by pathology to 79 drugs and drug combinations. Relative blast fraction (RBF) is the fraction of AML cells after 24 h of drug treatment relative to the mean fraction of AML cells after 24 h of control treatment. PCY score represents aggregated 1-RBF values across replicate wells and drug concentrations (see Methods). Thus, positive values indicate on-target reduction in AML cells. Samples and drugs are ordered by hierarchical clustering (Euclidean distance, complete linkage), a cluster of samples characterized by ex vivo resistance to common AML treatments is highlighted in red. b Volcano plot showing associations of PCY scores with clinical parameters shown in (a), for clinical characteristics with at least 5 patient observations (for exact sample- and patient numbers per comparison, see Source Data). X-axis corresponds to effect size (delta median(1-RBF)), y-axis represents −log10 uncorrected P value from two-sided two-sample Wilcoxon test. Labels correspond to “drug - clinical parameter name: clinical parameter value”. c Venetoclax (VEN) PCY scores stratified by whether or not a patient was exposed to VEN right before or at the time of sampling. P value as in (b). Box plots indicate the median (horizontal line) and 25% and 75% ranges (box), whiskers indicate the 1.5x interquartile range above or below the box, individual data points are displayed. d Selected 4i DRP features after 8 h of VEN ex vivo treatment normalized to control treatment, associated with VEN PCY score. Linear regression line with 95% confidence bands, corresponding Pearson’s R and P value (two-sided t-test) are indicated. Number of samples (n.sam) and number of patients (n.pat) are annotated for each panel.

