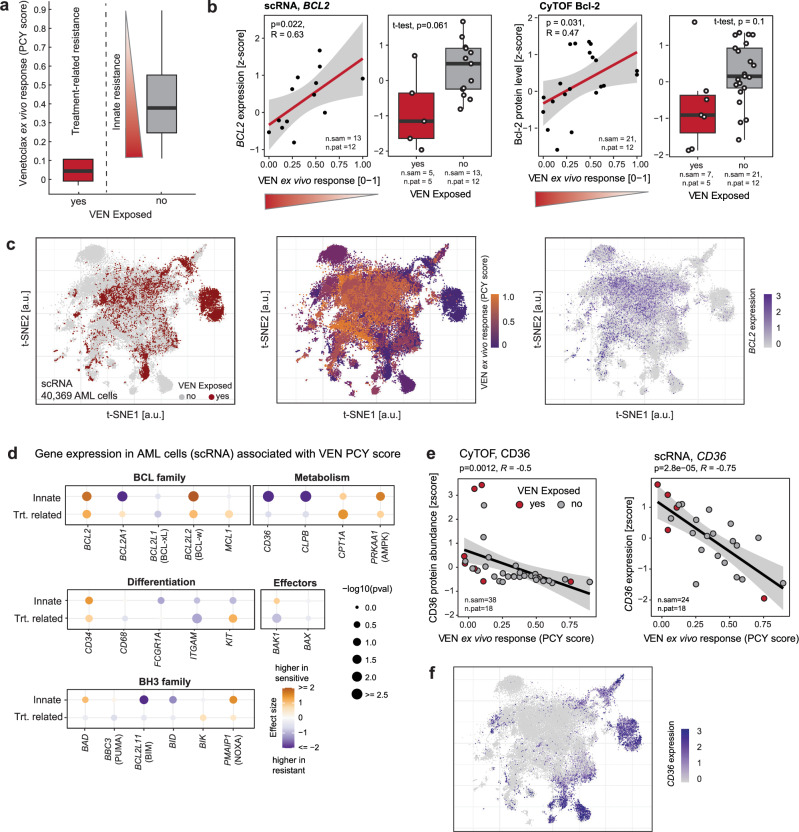
Fig. 3. The molecular landscape of innate and treatment-related VEN resistance.
a Definition of innate and treatment-related VEN resistance. Shown are VEN PCY scores for samples exposed to VEN at the time of sampling (treatment-related resistance, n = 7 samples from 5 patients) and VEN naive samples (n = 21 samples from 12 patients). Within the VEN naive samples, the spread of response scores defines the amount of innate resistance, with lower response scores indicating higher resistance. b RNA and protein levels of the VEN target Bcl-2 measured by scRNA-seq and CyTOF, averaged across all AML blasts per sample. Scatterplots show Bcl-2 levels as a function of innate resistance in VEN naive samples. Linear regression lines with 95% confidence bands, Pearson’s R, and corresponding P values (two-sided t-test) are indicated. Box plots compare Bcl-2 levels between VEN naive and exposed samples, P values from two-tailed Welch’s t-test. c t-SNE of scRNA-seq data, showing only cells classified as AML (n = 40’369 cells, 24 samples, 18 patients). Left: colored by prior VEN exposure, middle: colored by PCY-based VEN ex vivo response, right: colored by BCL2 expression. d Association of known genes involved in VEN resistance with innate or treatment-related VEN resistance. Values are derived from bulkified scRNA-seq AML cell transcriptomes. For treatment-related resistance, effect size corresponds to the delta mean gene expression between samples from patients that were or were not exposed to venetoclax, and P value was calculated using a two-sided Welch’s t-test. For innate resistance, the effect size and P value are obtained from a linear regression modeling gene expression as a function of VEN PCY score (see (a, b)). e Protein (left) and RNA (right) levels of CD36 as a function of VEN PCY score. Linear regression lines with 95% confidence bands, Pearson’s R, and corresponding P values (two-sided t-test) are indicated. f t-SNE as in (c), colored by expression of CD36. All analyses presented here were performed on samples with >5% blast content. In (a, b, and d), samples from patients who received venetoclax in earlier previous treatment lines were excluded. Number of samples (n.sam) and number of patients (n.pat) are annotated. Box plots indicate the median (horizontal line) and 25% and 75% ranges (box) and whiskers indicate the 1.5x interquartile range above or below the box.

