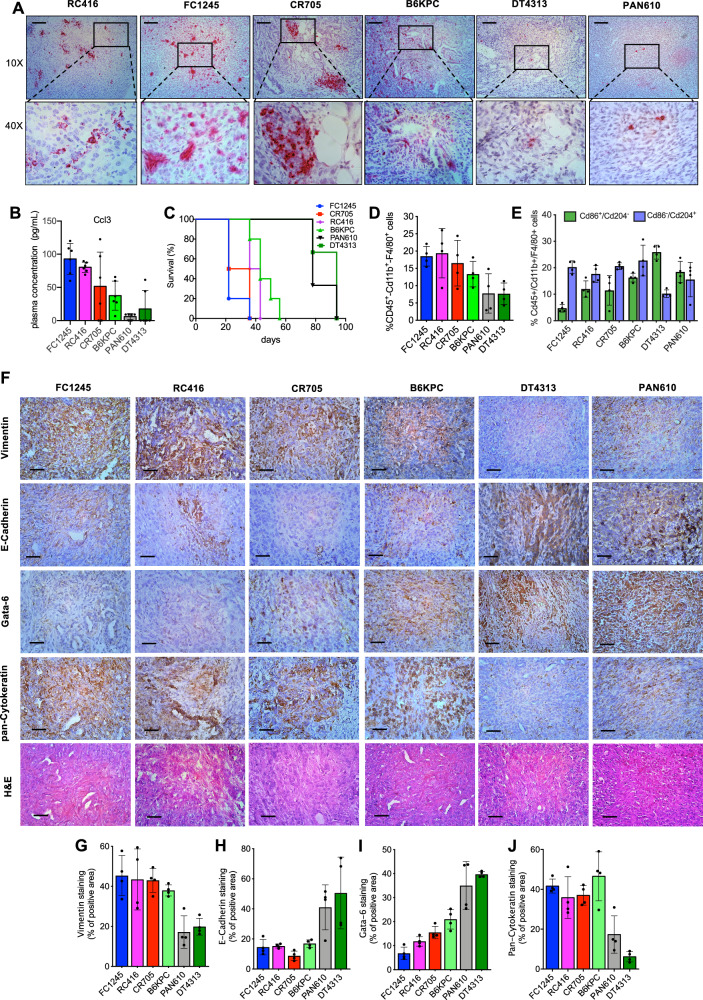
Fig. 2. Characterization of orthotopic murine PDAC tumors.
A Representative RNA in situ hybridization (ISH) images of Ccl3 in tumor sections from mice bearing FC1245, RC416, CR705, B6KPC, DT4313 and PAN610 cells. Scale bar: 150 μm. B Plasma levels of Ccl3 were measured in C57BL/6 J mice bearing orthotopic PDAC tumors from 6 different murine PDAC cell lines using Enzyme-Linked Immunosorbent Assay (ELISA). Data are expressed as mean ± s.d. (n = 6). C Median overall survival (mOS) of C57BL/6 J mice bearing orthotopic PDAC tumors (n = 6). D, E Flow cytometry analysis of Cd45+/Cd11b+/F4/80+ tumor-associated macrophages (TAMs) (D) and their M2 (Cd45+/Cd11b+/F4/80+/Cd204+/Cd86−)/M1(Cd45+/Cd11b+/F4/80+/Cd204−/Cd86+) ratio (E) in FC1245, RC416, CR705, B6KPC, DT4313 and PAN610 tumor samples. Data are expressed as mean ± s.d. (n = 4). F Representative images of FC1245, RC416, CR705, B6KPC, DT4313 and PAN610 tumors stained with E-cadherin, vimentin, gata-6, pan-cytokeratin antibodies and H&E. Scale bar = 60 μm. G–J Quantification of paraffin sections from orthotopic murine PDAC tumors stained as indicated in (F). Data are expressed as mean ± s.d. (n = 4).

