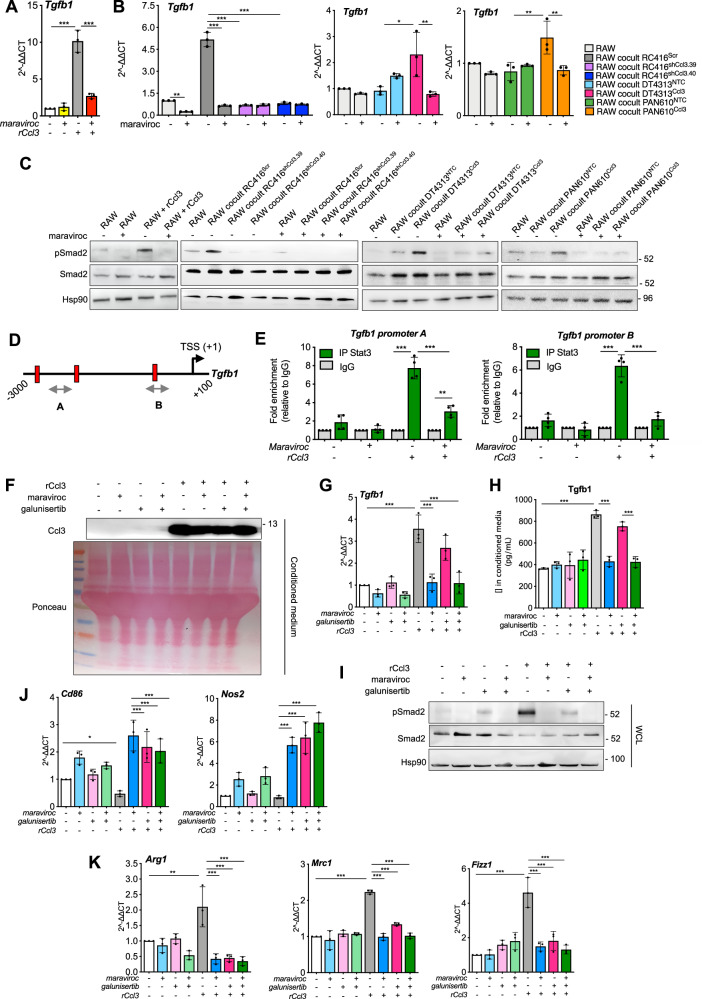
Fig. 5. The Ccr5 inhibitor maraviroc prevents the Ccl3-mediated activation of TGFβ signaling in macrophages.
A qPCR of Tgfb1 in RAW264.7 macrophages in presence or absence of rCcl3, after treatment with DMSO or 5 μM maraviroc. Results show mean ± s.d (n = 3). B qPCR of Tgfb1 in RAW as single cultures or co-cultured with RC416, DT4313 or PAN610 transduced as indicated, after treatment with DMSO or maraviroc (5 μM). Results show mean ± s.d (n = 3). C Representative western blot of pSmad2 and Smad2 in RAW264.7 in presence or absence of rCcl3, and as single cultures or in co-culture with RC416, DT4313 and PAN610 transduced as indicated, after treatment with DMSO or 5 μM maraviroc. Hsp90 was used as loading control. D Schematic representation of Tgfb1 promoter (available at UCSC Genome Browser GRCm38/mm10) with the position of ChIP probes (gray double arrowhead) and consensus Stat3 binding sites (TTC(N)2-4GAA) (vertical slashes) relative to the transcription starting site (TSS). E ChIP-qPCR of Stat3 occupancy at the Tgfb1 promoter in RAW264.7 macrophages upon stimulus with rCcl3, in the presence or absence of 5 μM maraviroc. The y-axis represents relative promoter enrichment, normalized on input material. IgG was set to 1. Data are represented as mean ± s.d. (n = 4). F Representative western blot of secreted Ccl3 in the conditioned media of RAW264.7 macrophages stimulated or not with rCcl3, and treated with 5 μM maraviroc, 5 μM galunisertib, their combination or DMSO as control. G qPCR of Tgfb1 in RAW264.7 macrophages in the presence or absence of rCcl3 and treated as indicated. Results show mean ± s.d (n = 3). H Secreted levels of Tgfβ1 ligand measured in conditioned medium of RAW264.7 macrophages treated as indicated using Enzyme-linked immunosorbent assay (ELISA). Data are expressed as mean ± s.d. (n = 3). I Representative western blot of pSmad2 and Smad2 in RAW264.7 macrophages treated as indicated. Hsp90 was used as loading control. J, K qPCR of M1 (J) and M2 (K) markers in RAW264.7 macrophages in presence or absence of rCcl3 and treated as indicated. Results show mean ± s.d (n = 3). P values in (A, B, E, G, H, J and K) were calculated by one-way ANOVA and Tukey’s test. *p < 0.05; **p < 0.01; ***p < 0.001.

