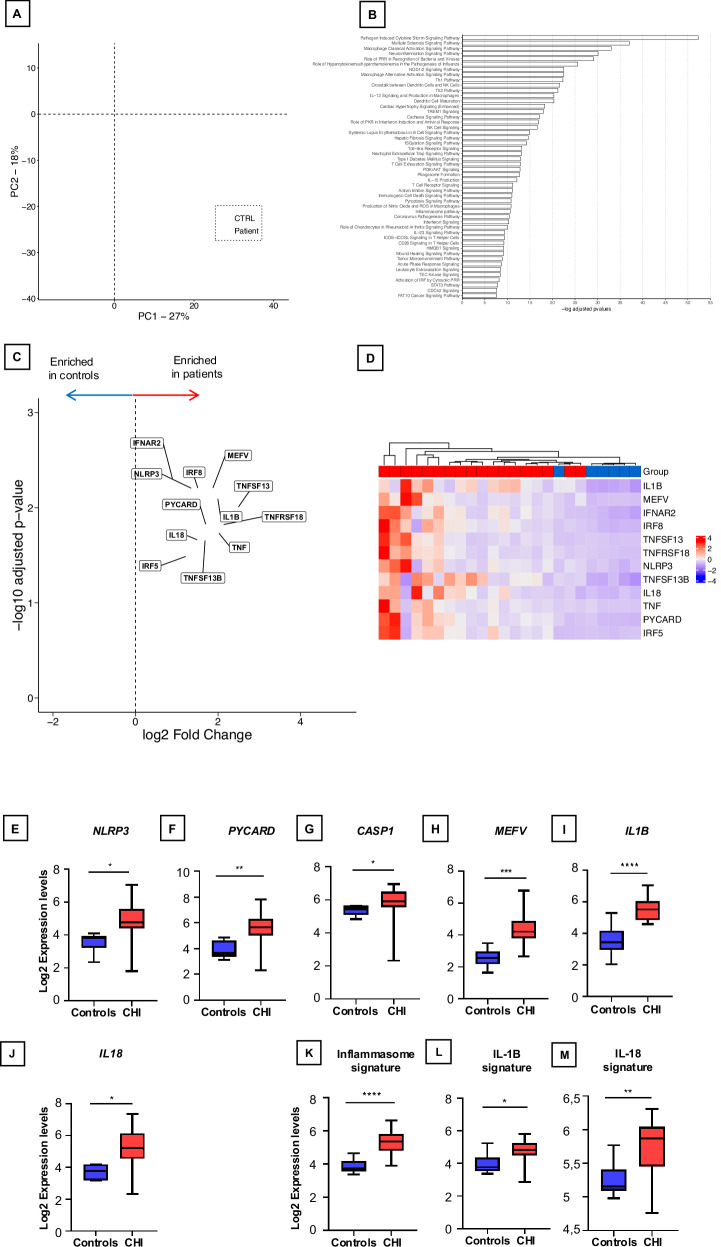
Fig. 1. Transcriptomic Profiling of the Inflammasome Pathway in CHI Placentas.
A Principal component analysis (PCA plot) of the placental transcriptomes. The PCA plot reveals a significant separation between the controls (CTRL) and CHI placentas (Patient). B Top canonical pathways upregulated in CHI. In red, canonical pathways involved in innate immunity, macrophage activation and inflammasome pathway. C Volcano plots identifying differentially expressed genes between CHI and controls. Genes involved in the inflammasome pathway are represented. D. Heatmap representation of inflammasome-related gene expression, organized by hierarchical clustering, depicting differences between healthy controls (n = 6) and CHI patients (n = 18). E–J Box-whisker plots of transcriptomic analysis reveals the log2 expression levels of key components involved in the inflammasome pathway: NLRP3, PYCARD, CASPASE-1, MEFV, IL-1β, and IL-18, respectively, in comparison between healthy controls and patients afflicted with CHI. K–M Box-whisker plots of transcriptional signature of the inflammasome pathway, IL-1β, and IL-18, respectively, across these groups. The horizontal line in each box is the median. The lower and upper ends of each box are limits of the first and third quartiles, and height of each box is the interquartile range. Statistical analysis was conducted using GraphPad Prism 9. P values between each group were determined by a Mann-Whitney U test; *P < 0.05; **P < 0.01; ***P < 0.001; ****P < 0.0001. All tests were two sided.

