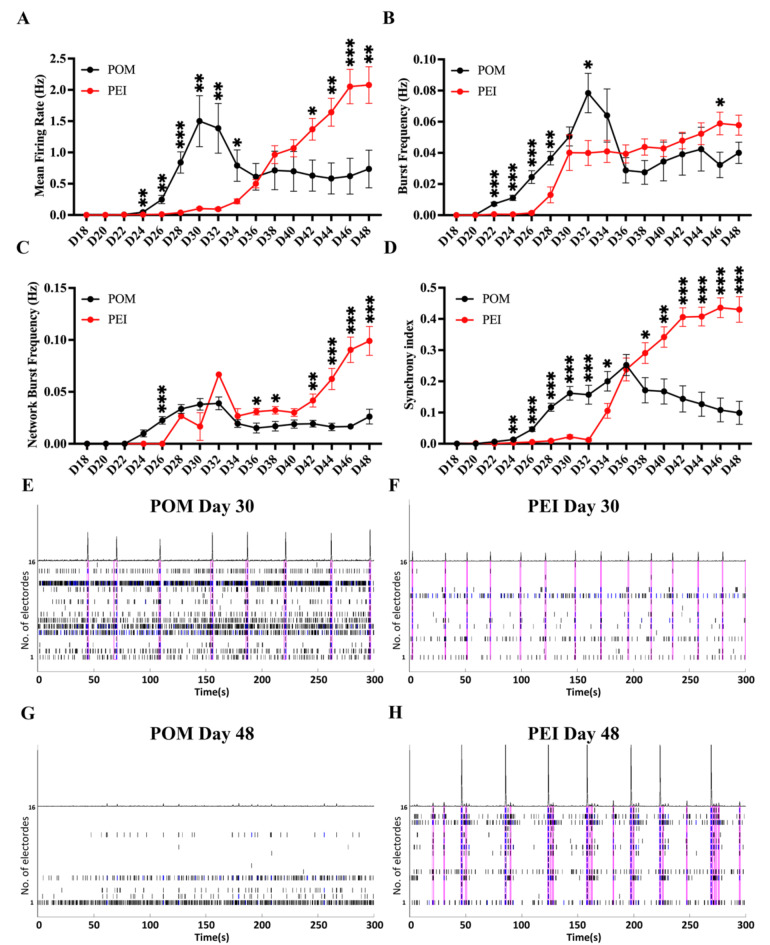
Fig. 4.
The iPSC-MNs showed different electrophysiological characteristics under the POM and PEI coating conditions. (A-D) Plots of MEA recording data for the mean firing rate (Hz) (A), burst frequency (Hz) (B), network burst frequency (C) and synchrony index (D) from the longitudinal recording of day 18 to 48 of iPSC-MNs on the POM or PEI-coating conditions. (E–H) Roaster plot of MEA recordings showing representative changes in spike firing pattern on day 30 (E, F) or 48 (G and H) on the POM- (E and G) or PEI- (F and H) coated 48-well MEA plates. The ticks indicate the time of a neuronal action potential or “spike” detected, and each row indicates firing of one electrode. The series of blue ticks indicate the bursts detected in 100 ms ISI. The ticks included in a network burst were outlined by magenta boxes. Above the raster is a filtered population spike time histogram, showing the total number of spikes occurring throughout the well at each time, and a higher peak represents more spikes detected at that time point, as a synchrony index in some extent. In this study, the total recorded wells were n = 24 in the POM-coating condition and n = 45 in the PEI coating condition from three independent cell lines. The data were presented as the mean ± SEM. Variations among groups were examined using multiple unpaired student’s t test. *p < 0.05, **p < 0.01 and ***p < 0.001. See also Figs. S3–S4 and Tables S2–S3.

