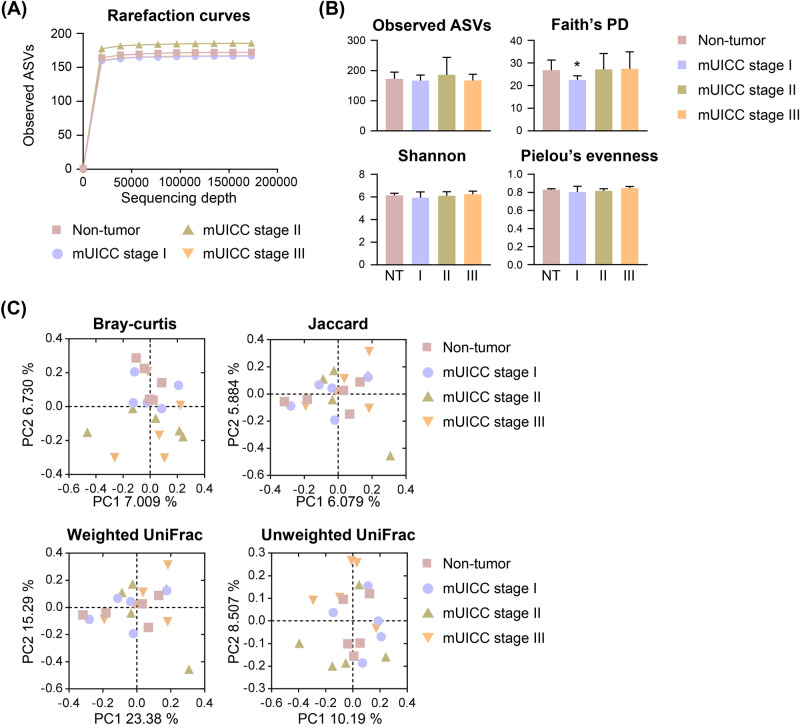
Fig. 2.
Microbial diversity in the liver of patients with HCC. (A) Rarefaction curves of the four groups demonstrating saturation: Non-tumor (NT), mUICC stage I (I), mUICC stage II (II), and mUICC stage III (III). The x-axis represents the number of sampled sequences, and y-axis represents the observed amplicon sequencing variants (ASVs). (B) Alpha diversity boxplots are illustrated for the observed ASVs, Faith’s phylogenetic diversity (Faith’s PD), Shannon, and Pielou’s evenness indices. Data are presented as mean ± SD. Statistical analysis was conducted using a one-tailed Student’s t-test (*p < 0.05) compared to the NT group. (C) Principal coordinates analysis (PCoA) plots generated based on Bray–Curtis distances, Jaccard, weighted-UniFrac, and unweighted-UniFrac indices among samples of the four groups. No significant differences were observed among the groups as PERMANOVA.

