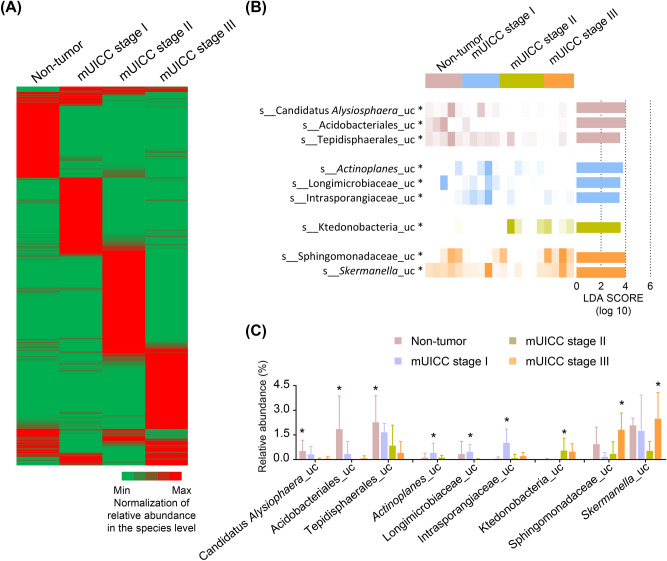
Fig. 4.
Differential composition in the hepatic microbiome across HCC mUICC stages. (A) Normalized heatmap of bacterial abundance at the species level in the Non-tumor, mUICC stage I, mUICC stage II, and mUICC stage III groups. (B) Linear discriminant analysis (LDA) score and p-value computed from differentially abundant bacteria among the groups at the species level, using the linear discriminant analysis effect size (LEfSe) algorithm. Statistical analysis was performed using LEfSe. Features with an LDA score > 2 were assessed, followed by Kruskal–Wallis test with a Wilcoxon test cut-off of p < 0.05 (*p < 0.05). (C) Relative abundance of significantly increased taxa in each group, followed by Kruskal–Wallis test with a Wilcoxon test cut-off of p < 0.05 (*p < 0.05). Values are expressed as mean ± SD. uc, unclassified taxa.

