Table 2.
Initial Exploration of Active Moieties. Ratio (Spontaneous/compound) of half-times (t1/2) of reactivation for compounds (1mM) with RHuAChE after inhibition by the indicated agent.
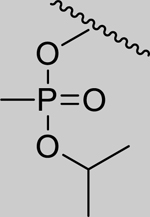
|
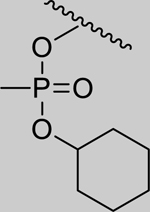
|
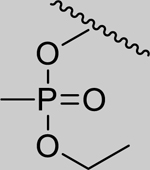
|
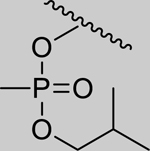
|
Inhibition of RHuAChE @ 1mM | ||
|---|---|---|---|---|---|---|
| GB | GF | VX | VR | |||
| Spontaneous Reactivation (t1/2 in days) | 2.01 (±0.07) | 1.25 (±0.14) | 1.18 (±0.21) | 0.35 (±0.07) | ||
| 1 |
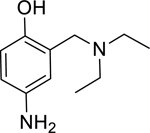
|
361* (158–824) | 164* (97.3–277) | 1,069* (393.6–2911) | 14,723* (6.46–33,573,761) | 60% (±1) |
| 2 |

|
1.51* (1.12–2.03) | 1.54* (1.34–1.78) | 1.87* (1.24–2.84) | 3.65* (3.14–4.24) | 0% (±6) |
| 3 |
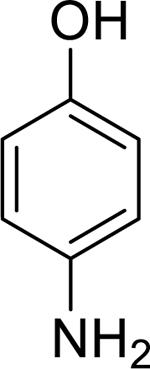
|
2.24* (1.98–2.53) | 1.48* (1.15–1.91) | 2.24* (1.16–4.32) | 14.3* (8.86–23.0) | 0% (±6) |
| 4 |

|
0.98 (0.81–1.20) | 0.93 (0.89–0.97) | 0.97 (0.66–1.43) | 0.96 (0.61–1.51) | 0% (±6) |
| 5 |
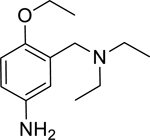
|
1.54* (1.28–1.84) | 0.89 (0.77–1.03) | 1.11 (0.53–2.34) | 1.25 (0.90–1.73) | 5% (±4) |
indicates that t1/2 in presence of compound is significantly less than spontaneous using a ratio t-test with p<0.05.
Standard deviation of at least three independent experiments is indicated for spontaneous reactivation half-times in days. 95% confidence intervals of ratios are indicated below each value.
All half-times were determined using RHuAChE in the presence of 1mM compound as the positive control. The far right column indicates the level of inhibition of RHuAChE caused directly by the compound at 1mM when compared to a buffer only control of RHuAChE at the same concentration. Standard deviation of this value determined using controls from all independent experiments is indicated.
