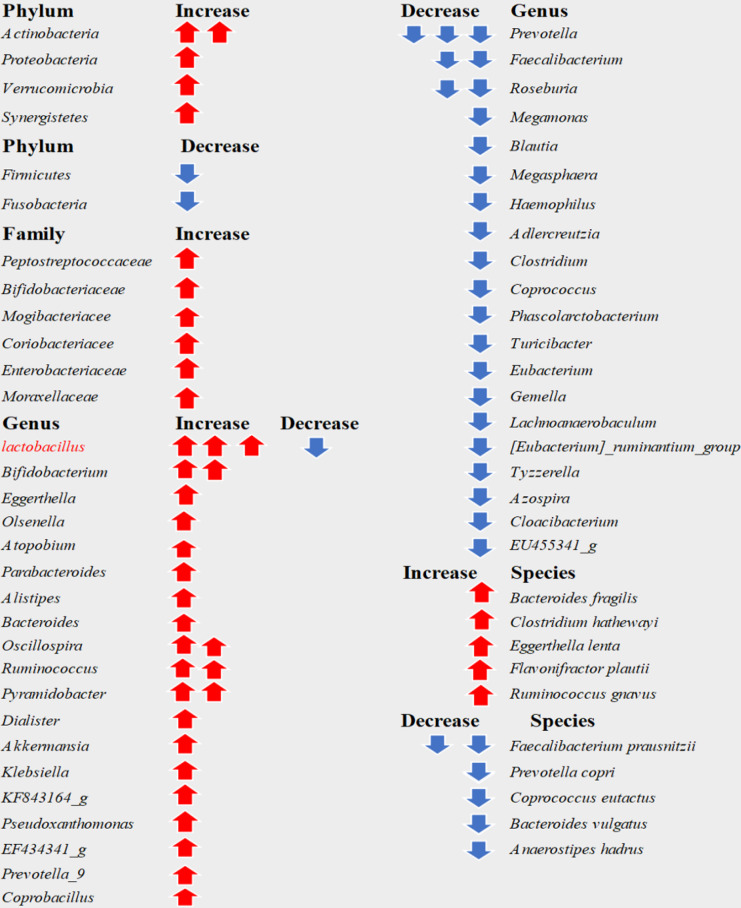
Figure 2.
Changes in the gut microbiota composition in older adults with frailty compared to the controls. Red arrows indicate increasing relative abundance; blue arrows indicate decreasing relative abundance in older adults with frailty compared to the controls; One arrow represents one analyzed study.

