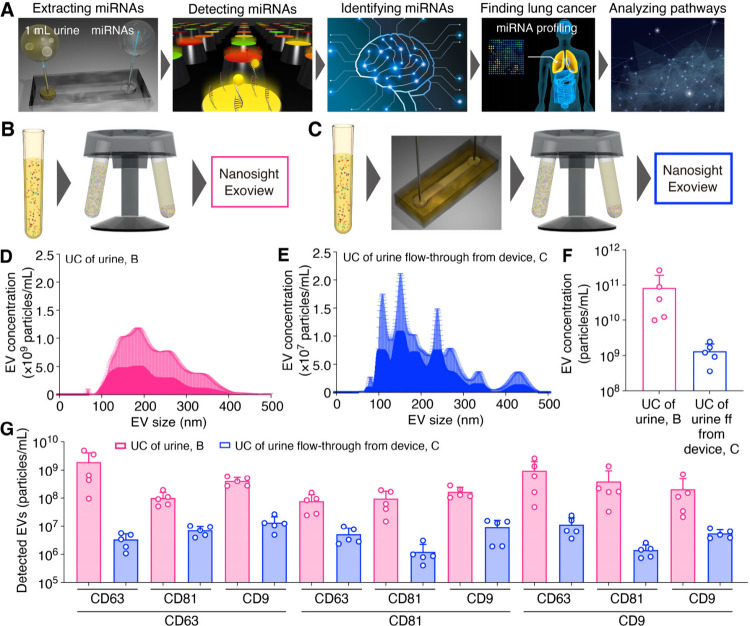
Figure 1.
Nanowire-assisted extraction of exosomal miRNAs in urine. (A) Schematic illustrations for miRNA extraction from urine using a nanowire device, nanowire-extracted miRNA detection using microarrays with 2565 species probes, identification of microRNA ensembles based on fluorescence intensity analysis of each miRNA species using a logistic regression-modeled classifier, pathway analysis of identified miRNA ensembles, and lung cancer detection using identified miRNA ensembles. (B) Schematic illustrations for EV analysis in raw urine. (C) Schematic illustrations for EV analysis in flow-through urine from the device. (D) EV size distribution of urine samples after ultracentrifugation (UC). (E) EV size distribution of UC of urine flow-through from the device. (F) EV concentration of UC of urine and UC of urine flow-through from the device. (G) Membrane protein expression levels of UC of urine and UC of urine flow-through from the device. The line below the x-axis represents the captured antibody type, and the line above it indicates the corresponding fluorescent-labeled antibody. For instance, the CD81 line above the CD63 line signifies that EVs captured with the anti-CD63 antibody were detected using the fluorescently labeled anti-CD81 antibody. (D-G) Error bars show the standard deviation for a series of measurements, N = 5.

