. 2024 Oct 23;12(47):12307–12319. doi: 10.1039/d4tb01628a

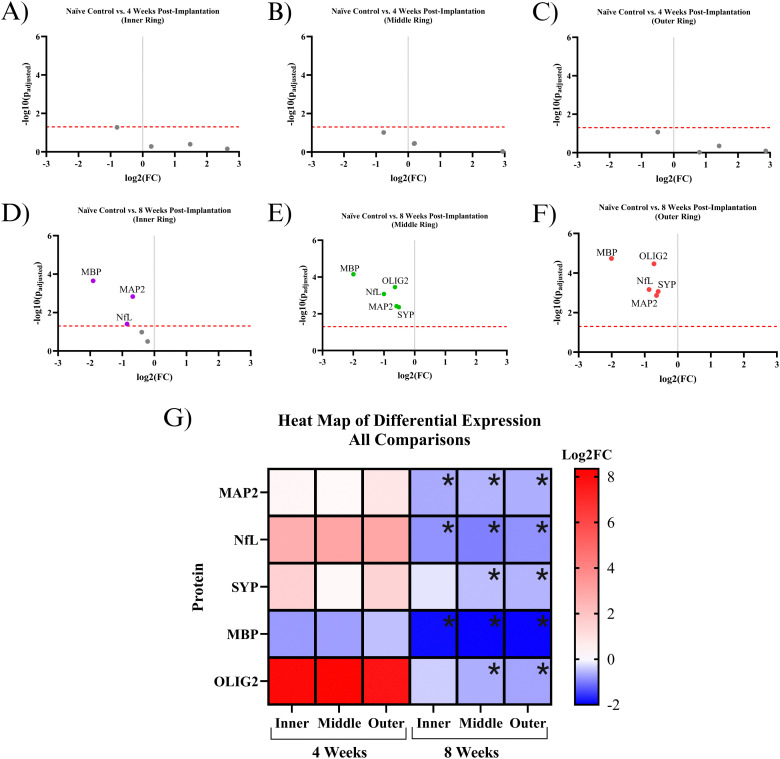
Fig. 4. Quantification of protein counts. (A)–(C) Volcano plots of protein expression within the NeuN+ region in 4-weeks post-implantation mice compared to the NeuN+ region in naïve control mice. The red line is the significance threshold padj < 0.05. All significant proteins are labeled (only MBP). (D)–(F) Volcano plot of protein expression within the NeuN+ region in 8-weeks post-implantation mice compared to the NeuN+ region in naïve controls. All significant proteins are labeled (all proteins were significant in the middle and outer regions). (A) and (D) Analysis of inner ring only. (B) and (E) Analysis of middle ring only. (C) and (F) Analysis of outer ring only. (G) Heat map of protein expression. This figure combines data from (A)–(F). Black asterisks represent significant differential expression between experimental groups compared to naïve controls. The log2FC scale on the right represents comparisons that have significant differential expression, ranging from low magnitude log2FC values (dark blue) to high magnitude log2FC values (red). This figure was assembled with https://BioRender.com.

Fig. 4